Figures & data
Figure 1. Conceptual risk framework defining the risk of opium poppy cultivation, with its subcomponents of environmental and climatic suitability and socio-economic vulnerability. The suitability is mainly embedded within environmental conditions, whereas the vulnerability is defined by societal drivers. For both components appropriate intervention measures can be identified (built on Birkmann et al. Citation2013; Kienberger and Hagenlocher Citation2014).
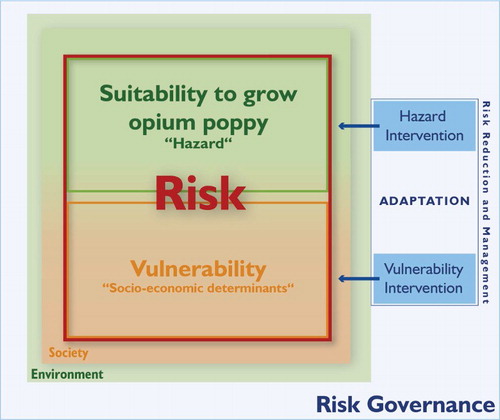
Table 1. Properties of the selected indicators for environmental poppy suitability.
Table 2. Normalized values for each land cover class to represent the land use/land cover indicator (S1).
Table 3. EcoCrop model parameters for climate suitability indicator (S3).
Table 4. Properties of the selected indicators for socio-economic vulnerability.
Figure 2. Homogeneous regions of environmental suitability to opium poppy cultivation in Afghanistan, province borders are overlain in white colour.
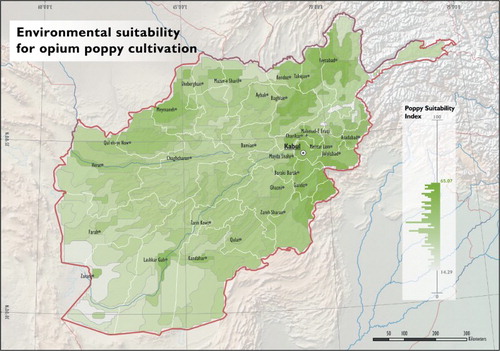
Figure 3. Homogeneous regions of socio-economic vulnerability to opium poppy cultivation in Afghanistan, province borders are overlain in white colour.
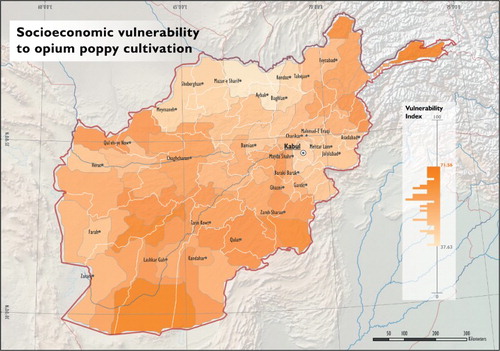
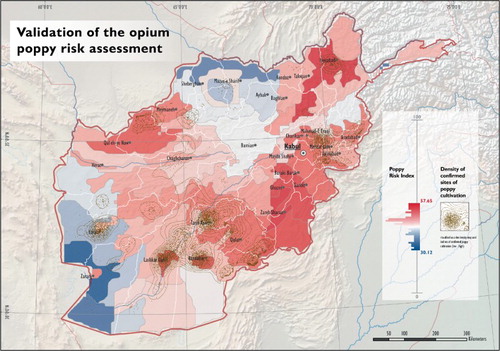
Figure 4. Risk map integrating environmental suitability and socio-economic vulnerability. Eight regions are highlighted for a detailed inspection (see ).
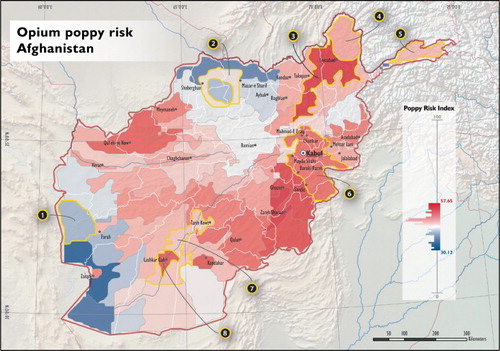
Figure 5. Decomposition of factors for selected regions (see ). The bar charts visualize the absolute and unweighted mean indicator value per region. The bar charts show the contribution of the environmental suitability and socio-economic vulnerability to the weighted risk index. The size of the pie charts reflects the risk index value.
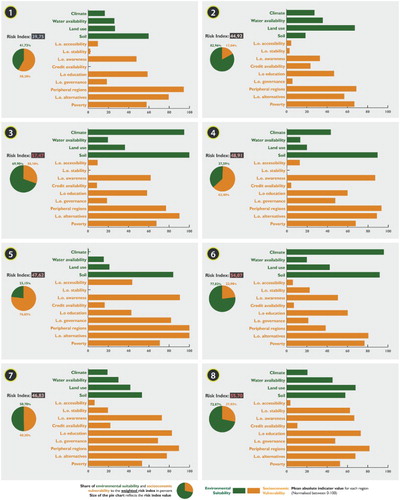
Figure 6. Opium poppy risk regions in comparison with the density of confirmed sites of poppy cultivation (shown as dot density maps; dots do not represent real locations of opium poppy fields).