Figures & data
Table 1. The structural and optical parameters of the four forest stands.
Figure 1. The background reflectance in the two RAMI stands.
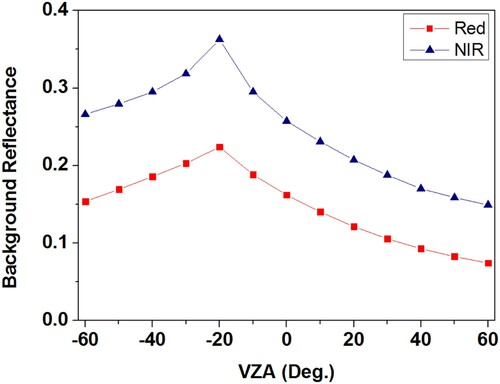
Figure 2. Schematic of three tree spatial patterns that lead to different forest coverages. (Green circles mean crowns at nadir. (a) the Poisson model, only randomness among trees are considered which produces a medium degree of overlap among trees; (b) the Neyman model, both patchiness and randomness among trees are considered which produces the most overlap among trees and the minimum vegetation coverage; and (c) the hypergeometric model, both exclusion effect and randomness among trees are considered which produces a minimum degree of overlap among trees and the maximum forest coverage in all three models).
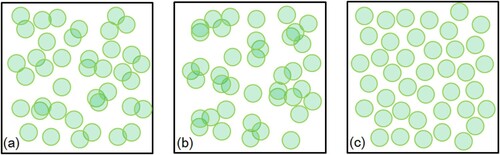
Figure 3. Schematic of the hypergeometric model for tree crowns in a forest plantation stand with an increment of RASD. (Green circles represent crowns at nadir; gray circles are the ‘crust’ of trees, which is a rigid body and cannot overlap with other crowns. The size of the gray circles represents the exclusion distances among tree crowns. (a) the size of the ‘crust’ is zero, RASD = 0, the hypergeometric model is actually the Poisson model; (b) the ‘crust’is inside the crown, RASD < 1; (c): ‘crust’ is the crown itself, RASD = 1; and (d) the ‘crust’ is larger than the crown, RASD > 1. The oblique outside of the crown is the pseudo reject area and need to be removed when calculating the gap fraction because the region is not actually a crown)).
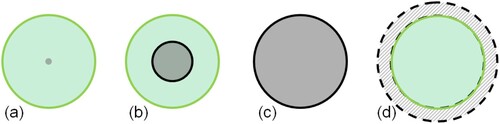
Figure 4. Tree positions in the two RAMI forest stands ((a) HET-10; (b) HET-20. Red circles are tree crowns at nadir).
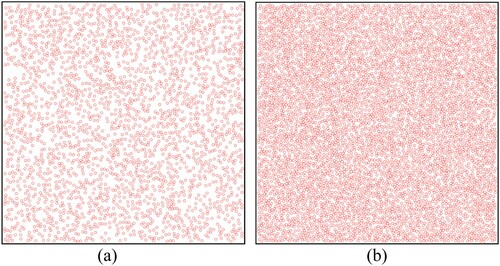
Figure 5. Tree positions in sample plots of two forest plantations (1: PS stand; 2: DL stand). ((a) Exclusion distances among trees are found in the plot from UAV high-resolution images. (b) Tree positions in the sample plot are identified from UAV high-resolution images. The red circles represent crowns at nadir).
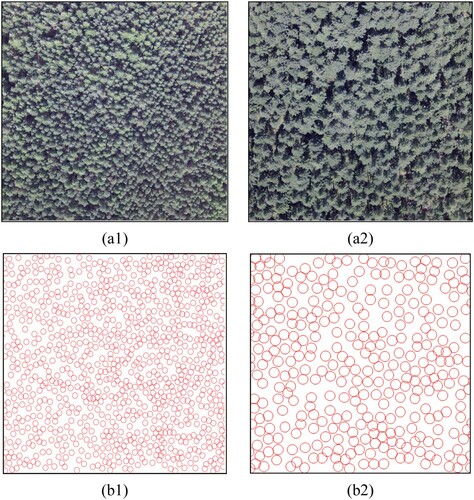
Figure 6. The tree distribution in the four forest stands divided in 100 quadrats compared with the Poisson, Neyman and hypergeometric model (m2 in the Neyman model indicates the average number of trees in a cluster. The default value of m2 in the Four-Scale model is 5. A larger value of m2 means stronger clumping of the trees and a broader line distribution (Chen and Leblanc Citation1997)).
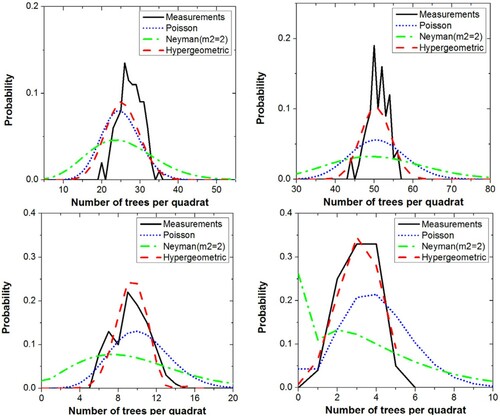
Figure 7. Image classification methods for calculating GF at different VZAs in the HET-20 stand (Green areas are crowns; red areas are backgrounds).
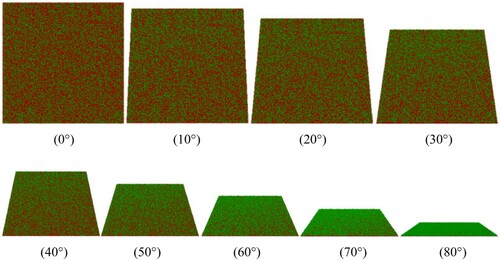
Figure 8. Comparison of gap fractions with the tree Poisson distribution and hypergeometric distribution.
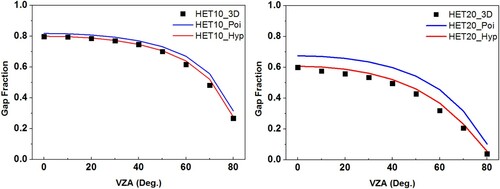
Figure 9. Comparison of vegetation coverage varying with tree number between the Poisson model and the hypergeometric model with RASD = 1 (crown radius is 0.5 m).
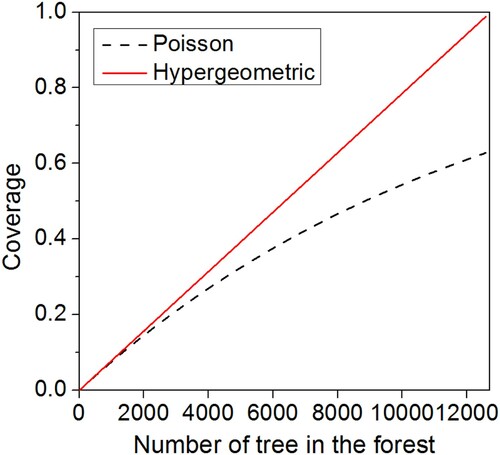
Figure 10. Comparison of the classified and simulated area ratios of the four scene components in the principal plane from GOST2 with the Poisson tree distribution and GOFP with the hypergeometric tree distribution.
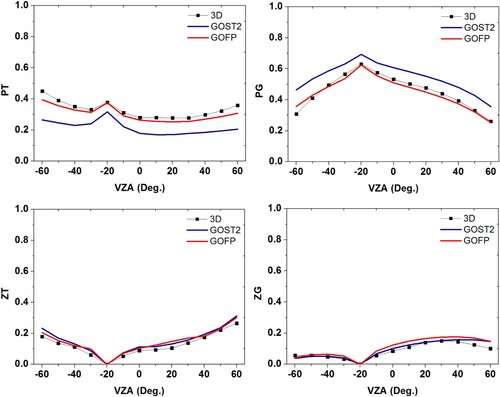
Figure 11. Schematic of the area ratios of the four scene components at VZA = 60° in the forward direction (Green regions are sunlit crowns, black regions are shaded crowns, red regions are sunlit background, and blue regions are shaded background. Black regions are highly overlapped with each other, while green regions are rarely overlapped by neighboring crowns in the view directions).
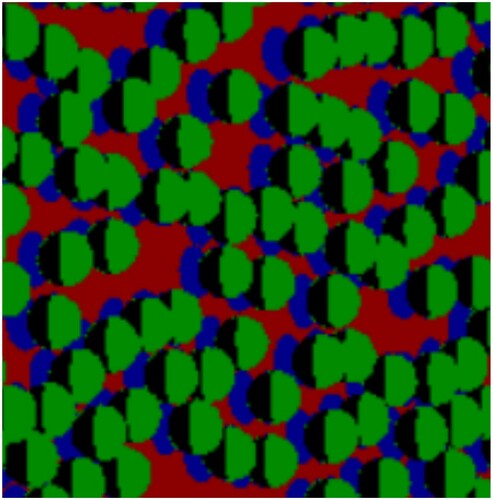
Figure 12. Comparison of BRFs using the four BRDF models in the principal plane in the red and NIR bands, respectively.
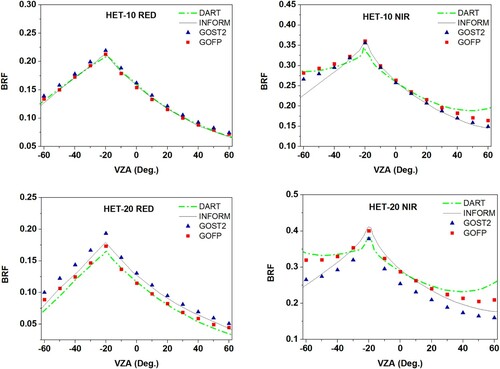
Figure 13. Comparison of BRFs measured by UAV and simulated by the four BRDF models in the principal plane in the 670 nm (red) and 800 nm (NIR) bands, respectively.
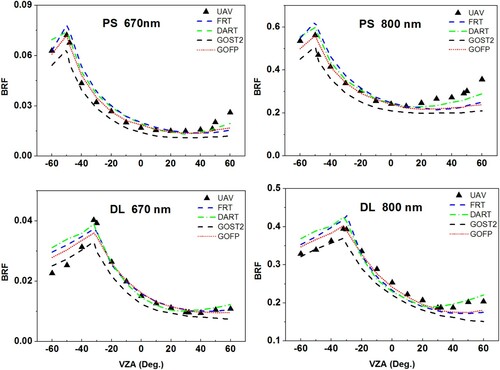
Table 2. The observation angles and sun angles in the four forest stands.
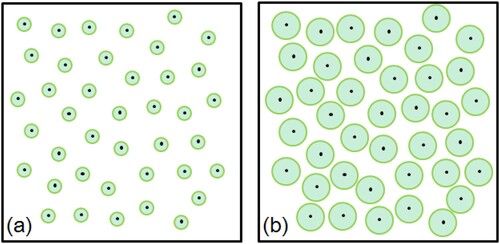
Figure 14. Schematic of two stands with the same tree positions but the different tree distributions in this study. (Green circles represent crowns at nadir, black dots mean trunks; RASD is greatly larger than 1 in stand (a), but is about 1 in stand (b)).