
Figures & data
Figure 1. Cruise tracks of the seventh Chinese Arctic expedition with ice station (IS) location and identification (numbers and date (MMDD)); LIS denotes the 8-day long-term ice station from 7 August to 15 August.
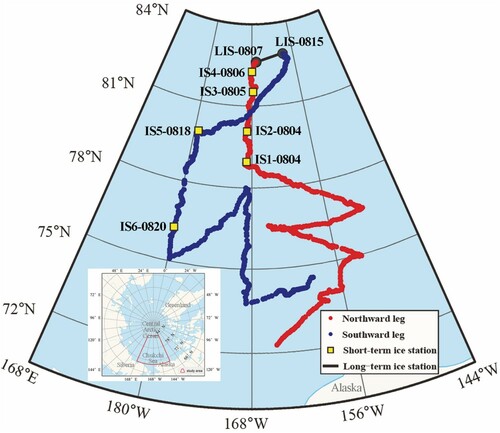
Figure 2. Instruments used for observations of (a) snow depth, (b) snow density of surface layer (0∼3 cm), (c) snow density sub-surface layer (greater than 3 cm), and (d) snow grain size during the seventh Chinese Arctic expedition.
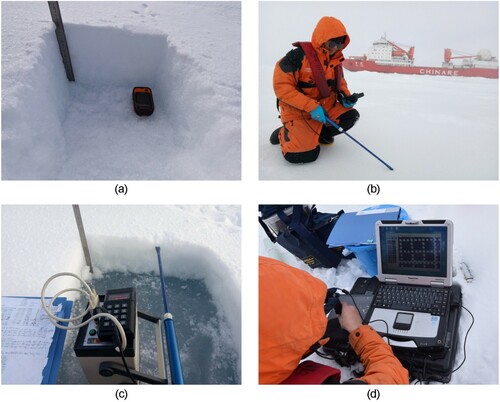
Table 1. General information for snow measurements on sea ice in ice stations during the seventh Chinese Arctic expedition.
Figure 3. Variations of snow depth with the latitude during the seventh Chinese Arctic expedition at (a) short-term ice and (b) long-term ice stations. The vertical bars reflect the value range of the measured snow depth at each ice station. The vertical bars reflect the value range of the measured snow depth at each ice station.
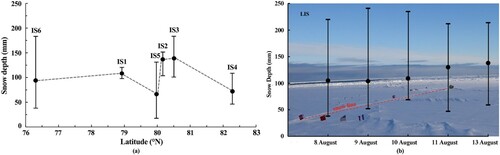
Figure 4. Variations of snow density at the surface layer and sub-surface layer of the snow with the latitude during the seventh Chinese Arctic expedition. The vertical bars reflect the value range of the measured snow density at each ice station.
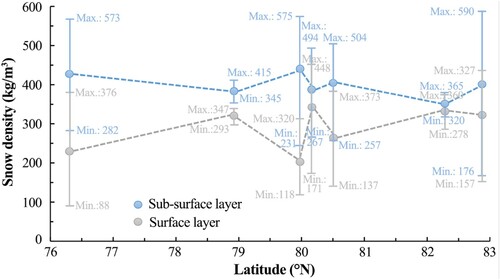
Figure 5. A schematic column of snow stratigraphy observed during the seventh Chinese Arctic expedition.
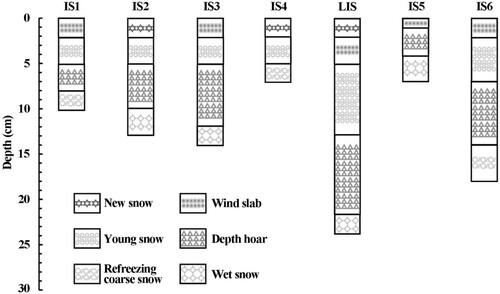
Figure 6. Snow grain size measured during the seventh Chinese Arctic expedition. (a) The equivalent snow grain size of the surface layer (0∼3 cm) and the sub-surface layer (greater than 3 cm) in snow pits, the minimum and maximum values of measured surface and sub-surface snow grain size were labeled using blue and red numbers, respectively; (b) Micro-photos of the different snow types, the red line and marks were the in-situ measured long half axis (a) length and short half axis (b) length of an assumed ellipsoid equivalent to the snow grain which could be used to calculate snow grain size based on Equation (2) and Equation (3).
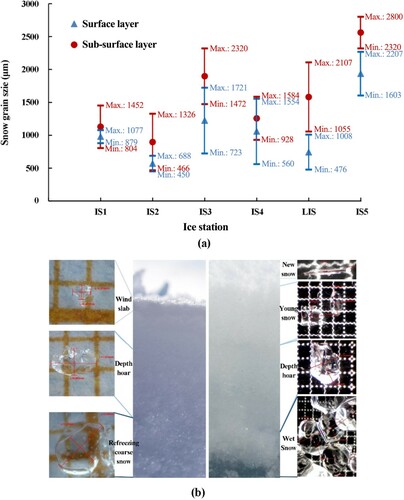
Figure 7. Spatial distribution of MODIS-derived snow grain size on Arctic sea ice from (a) 11 July to 18 July, (b) 19 July to 26 July, (c) 27 July to 3 August, and (d) 4 August to11 August. The locations of in-situ ice stations for snow grain size measured were presented in (d).
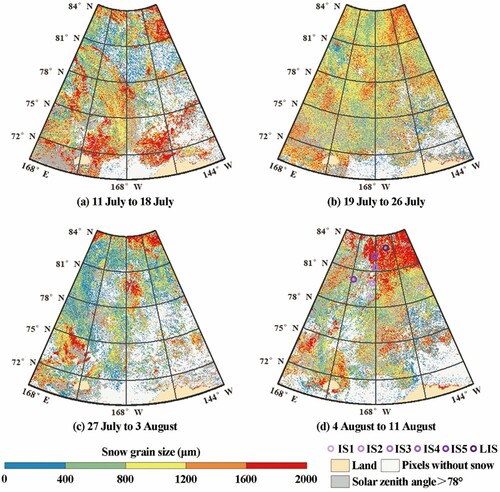
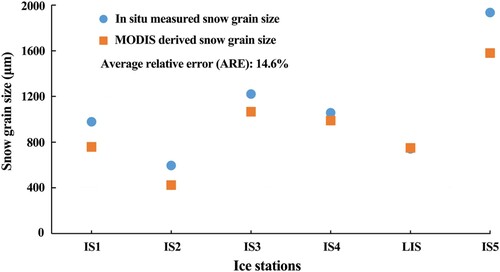
Figure 8. Comparison of MODIS-derived snow grain size and in situ measured surface snow grain size (at IS1 to IS5 and LIS) during the seventh Chinese Arctic expedition.
Data availability statement
The data that support the findings of this study are available from the corresponding author, upon reasonable request.