
Figures & data
Figure 1. COVID-19 Stringency Index for Ukraine.
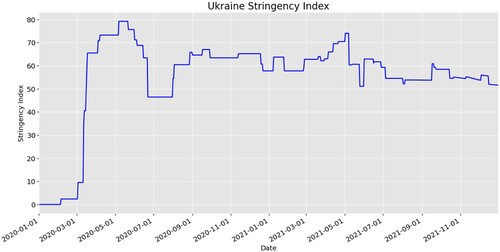
Figure 2. Variogram models for spatial interpolation used in the study.
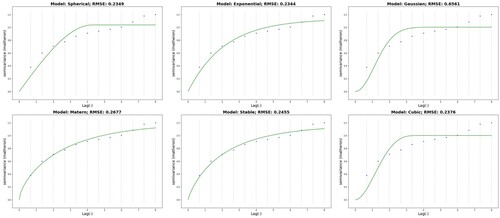
Figure 3. (a): December 2021 NO2 observation – OMI, TROPOMI, the difference between OMI and TROPOMI; (b): The correlation between re-gridded OMI and TROPOMI in December 2021 over Ukraine.
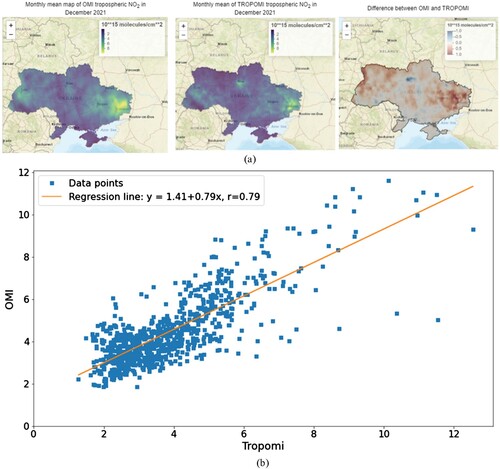
Figure 4. Architecture of the Ukraine Rapid Response Dashboard.
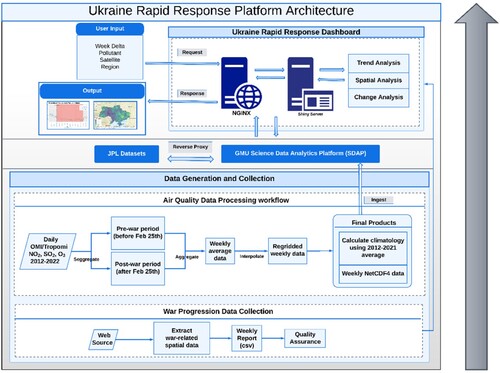
Figure 5. Air quality analysis workflow for the Ukraine Rapid Response Dashboard.
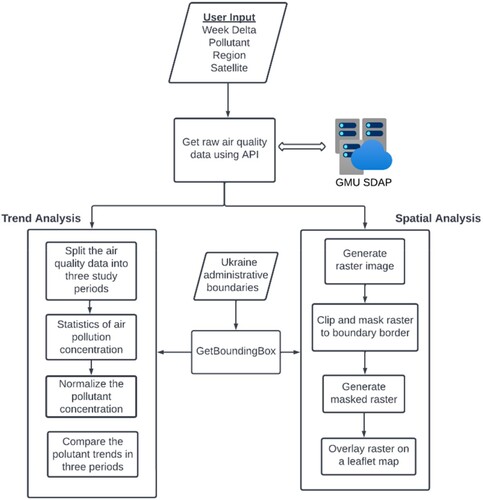
Figure 6. Default View of the Air Quality Analysis Tab.
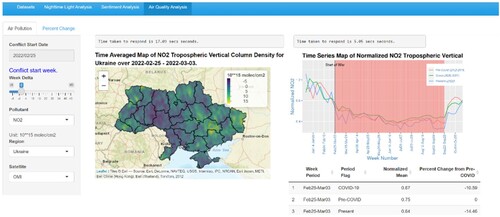
Figure 7. (a): NO2 anomaly derived by removing the climatic average; (b) SO2 anomaly derived by removing the climatic average; (c) O3 anomaly derived by removing the climatic average.
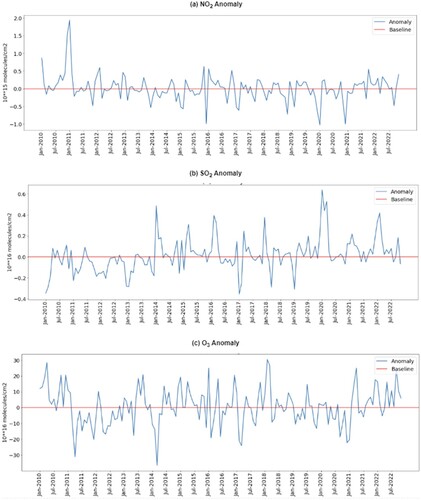
Figure 8. (a): Average tropospheric NO2 (2020) before lockdown (b) Average historical tropospheric NO2 (2012–2019) (c) Before lockdown tropospheric NO2 anomalies (d) Average tropospheric NO2 (2020) during lockdown (e) Average historical tropospheric NO2 (2012–2019) (f) During lockdown tropospheric NO2 anomalies. (g): Difference between anomalies of before and during the lockdown periods (c–f).
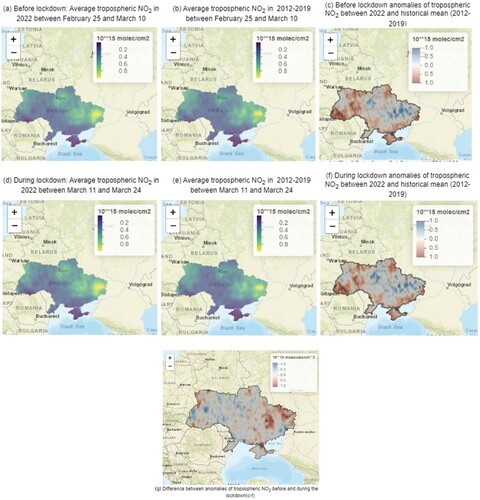
Figure 9. (a) Average tropospheric SO2 (2020) before lockdown, (b) Average historical tropospheric SO2 (2012–2019), (c) tropospheric SO2 anomalies before lockdown, (d) Average tropospheric SO2 (2020) during lockdown from 11 March–24 March, (e) Average historical tropospheric SO2 (2012–2019), and (f) tropospheric SO2 anomalies during lockdown. (g): Difference between anomalies of before and during the lockdown periods (c–f).
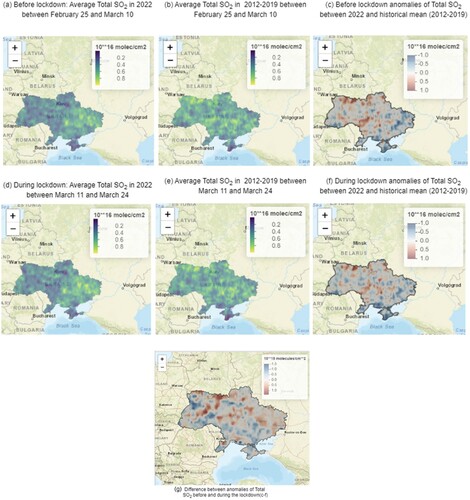
Figure 11. Spatial distribution of tropospheric NO2 over Kherson, Dnipro, Lviv, and Kharkiv.
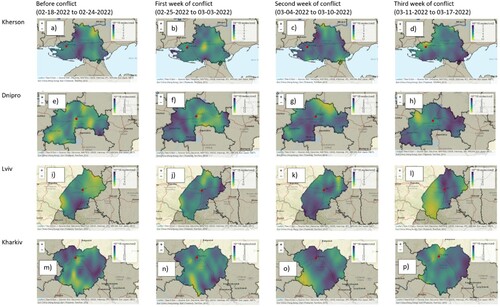
Figure 10. Spatial distribution of tropospheric NO2 over Ukraine. (a)–(b) are time-averaged maps of OMI tropospheric NO2 concentration from 4 February–24 February 2022, and 2012–2019. (c) difference between the weekly average (before the conflict started) of 2022 and 2012–2019. (d)–(e) are time-averaged maps of OMI tropospheric NO2 concentration from 25 February–17 March 2022, and 2012–2019. (f) difference between the weekly average (after the conflict started) of 2022 and 2012–2019. (g): Difference between anomalies before and after the war.
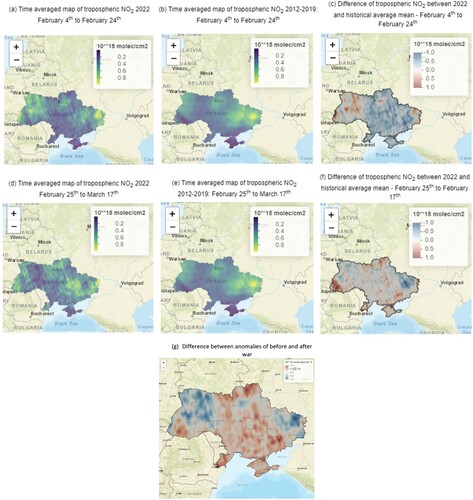
Figure 12. Spatial distribution of total column density SO2 over Ukraine. (a)–(b) are time-averaged maps of OMI total column density SO2 from 4 February–24 February 2022, and 2012–2019. (c) is difference between the weekly average (before the conflict started) of 2022 and 2012–2019. (d)–(e) are time-averaged maps of OMI total column density SO2 from 25 February–17 March 2022, and 2012–2019. (f) is difference between the weekly average (after the conflict started) of 2022 and 2012–2019. (g): Difference between anomalies before and after the war started.
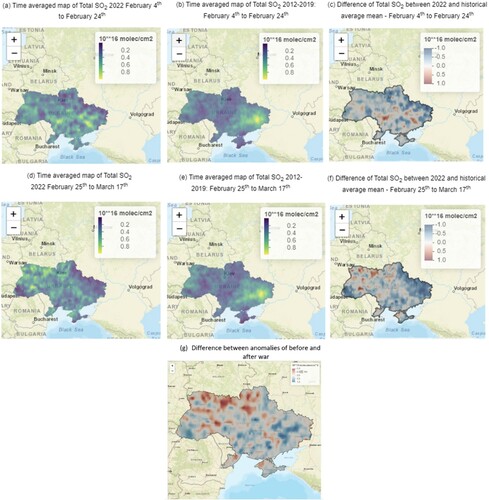
Figure 13. Spatial distribution of tropospheric SO2 over Kherson, Dnipro, Lviv, and Kharkiv
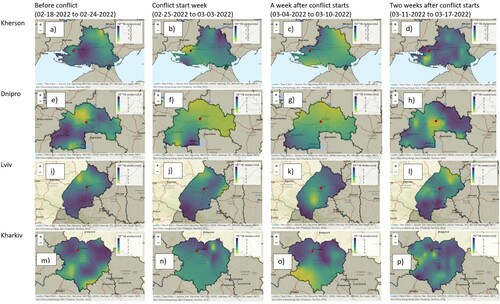
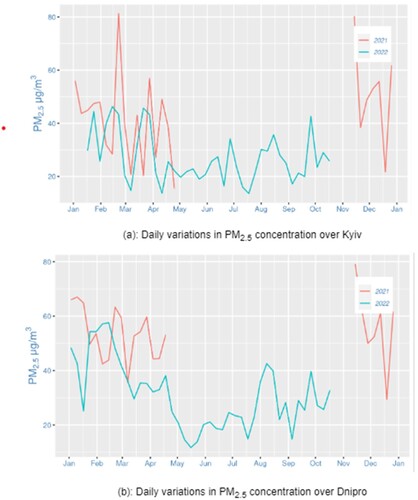
Figure 14. (a): Daily variations in PM2.5 Concentartion over Kyiv; (b). Daily variations in PM2.5 Concentartion over Dinpro.
Data availability statement
OMI NO2 data can be freely downloaded from the NASA GES DISC: https://disc.gsfc.nasa.gov/datasets/OMNO2d_003/summary; OMI SO2 can be freely downloaded from GES DISC: https://disc.gsfc.nasa.gov/datasets/OMSO2e_003/summary; OMI O3 can be freely downloaded from: https://disc.gsfc.nasa.gov/datasets/OMTO3e_003/summary. The Sentinel-5P Tropomi NO2 data can be freely downloaded from the European Space Agency Copernicus Open Access (https://scihub.copernicus.eu/) or the NASA GES DISC: https://disc.gsfc.nasa.gov/datasets/S5P_L2__NO2____1/summary.
Acknowledgements
We thank the NASA Goddard Earth Sciences (GES) Data and Information Services Center (DISC) for providing the Ozone Monitoring Instrument (OMI) NO2, SO2, and O3. We thank the European Space Agency (ESA) for providing the TROPOspheric Monitoring Instrument (TROPOMI) NO2. We would also like to thank the anonymous reviewers for their valuable comments.