Figures & data
Figure 1. Map of the study area: (a) Location of the Duiya Glacier, marked with a red star. The cyan lines depict the coverage of the ascending and descending Sentinel-1A SAR images. The background is the ALOS World 3D-30 m (AW3D30) data. (b) 3D view of the lake-terminating Duiya Glacier and its counterpart West Duosangpu Glacier. The yellow color outlines of glacial lakes were manually delineated from the Landsat-8 OLI image taken on September 26, 2017.
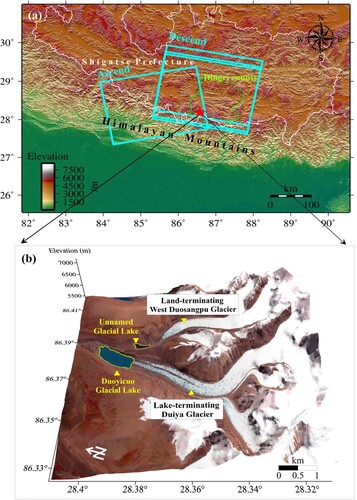
Table 1. The satellite images and DEM used in this study.
Figure 2. Research methodology flow chart.
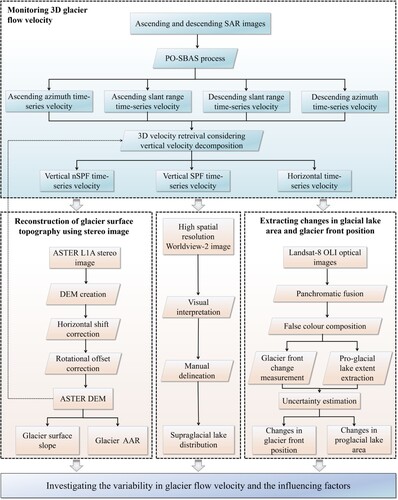
Figure 3. Spatial-temporal baseline distribution of Sentinel-1A SAR image pairs. (a) and (b) are respectively for ascending and descending tracks.
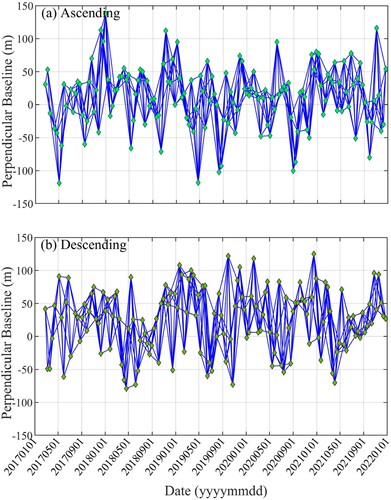
Figure 4. The 3D annual average velocity field of Duiya Glacier during 2017–2021. (a) Horizontal velocity field. (b) and (c) represent vertical nSPF and SPF velocity fields, respectively. Distance posts are placed every 2 km along the central flow line (AA’). The red rectangle in (a) is utilized to evaluate the PO-SBAS velocity observation error. The black curves in (b) represent the profiles shown in , with the beginning points of these profiles indicated by black solid circles.
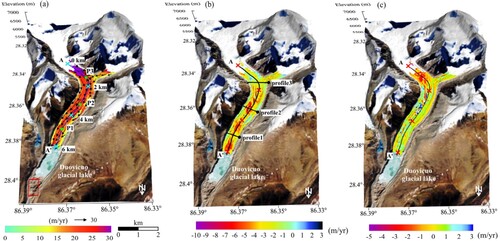
Figure 5. The 3D annual average velocity field of West Duosangpu Glacier during 2017–2021. Horizontal, vertical nSPF, and vertical SPF velocity fields are shown in (a), (b), and (c). Distance posts are placed every 2 km on the central flow line (BB’). The red rectangle in (a) is used to assess the error in PO-SBAS velocity observation. The black curves in (b) correspond to the profiles in , with the beginning points of these profiles denoted by cyan solid circles.
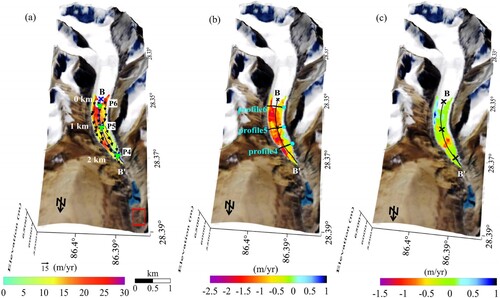
Figure 6. The Duiya glacier's time series changes of 3D velocities on the center line AA’ (marked in ) and corresponding error estimates from February 2017 to December 2021.
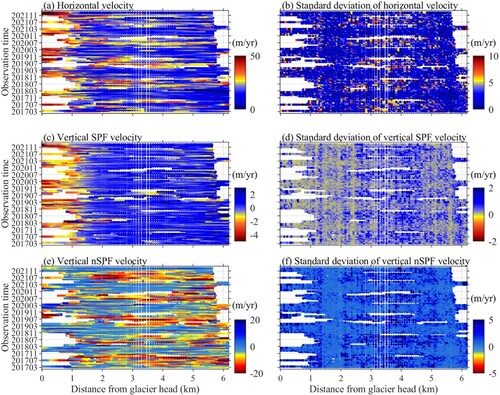
Figure 7. The Duiya glacier's time series changes of 3D velocities along the 3 profiles (marked in (b)) from February 2017 to December 2021. Top to bottom rows: horizontal, vertical SPF and nSPF velocity; left to right columns: profiles 1–3.
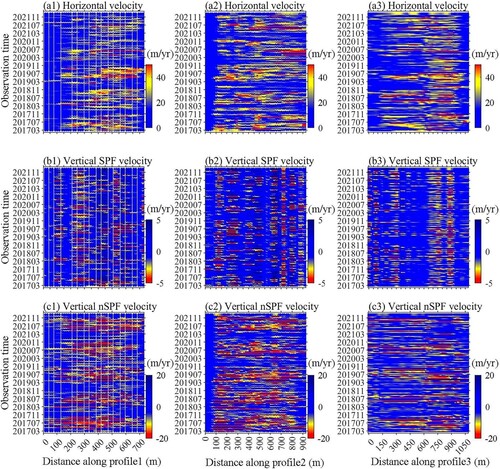
Figure 8. Temporal variations in the 3D velocity of the central line BB’ (marked in ) on the West Duosangpu Glacier and error estimates from February 2017 to December 2021.
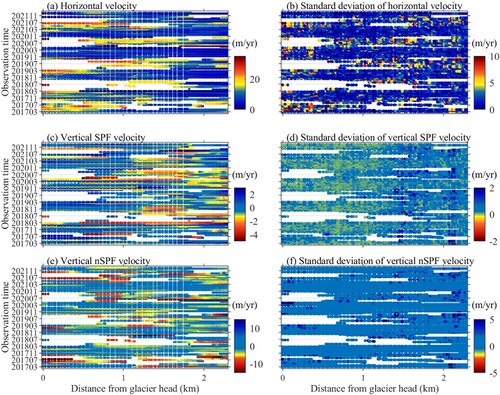
Figure 9. Temporal variations in the 3D velocity along the profiles (marked in (b)) on the West Duosangpu Glacier from February 2017 to December 2021. Top to bottom rows: horizontal, vertical SPF and nSPF velocity; left to right columns: profiles 4–6.
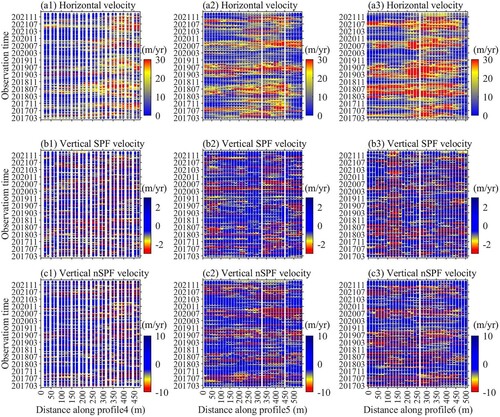
Figure 10. (a) Changes in glacier frontal position of Duiya and West Duosangpu Glacier during 2017–2021. The black lines depicted the open-ended boxes used to estimate front position changes. (b) Area development of the Duoyicuo Glacial lake and the ice-uncontacted West Duosangpu Glacial lake during 2017–2021. The background for (a) and (b) is the Landsat-8 OLI image taken on September 26, 2017. (c) Cumulative ice front change (black line) and lake area increase (red line) for Duiya glacier and its lake. (d) Lake area and cumulative ice front change for the West Duosangpu glacier and its un-contacted lake. Error bars in (c) and (d) represent uncertainties in estimating the glacial lake area and digitizing the glacier front positions (data from Table S2 – S4).
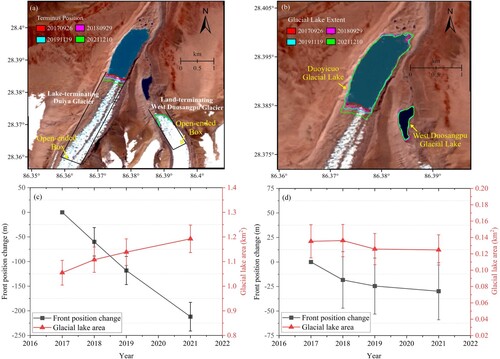
Figure 11. The distribution of supraglacial lakes on Duiya Glacier and West Duosangpu Glacier. The area within the black boxes in (a) is shown in enlarged images (b) and (c).
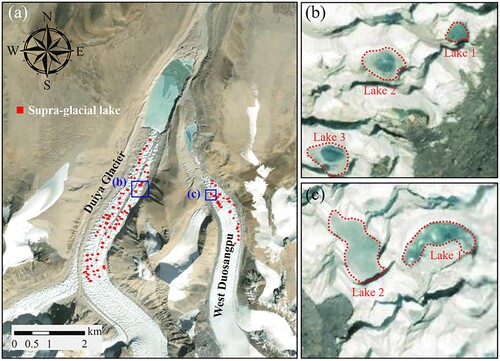
Figure 12. Variations in 3D velocities and glacier surface slope along the central flow line AA’ for Duiya glacier (a) and BB’ for West Duosangpu glacier (b). The central flow lines AA’ and BB’ are marked in (a) and (a) respectively.
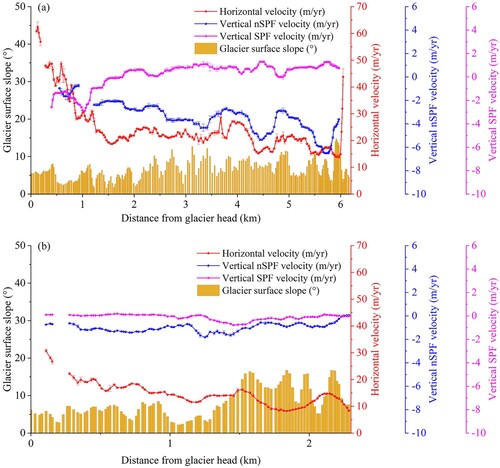
Figure 13. The relationship between air temperature and horizontal, vertical nSPF and SPF velocities at points P1 – P3 of the Duiya Glacier. Solid red lines show the result of the linear fit.
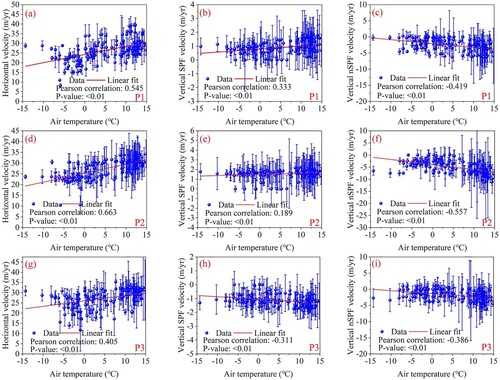
Figure 14. The relationship between the 3D glacier flow velocities and precipitation fluctuations at points P1 – P3 of the Duiya Glacier.
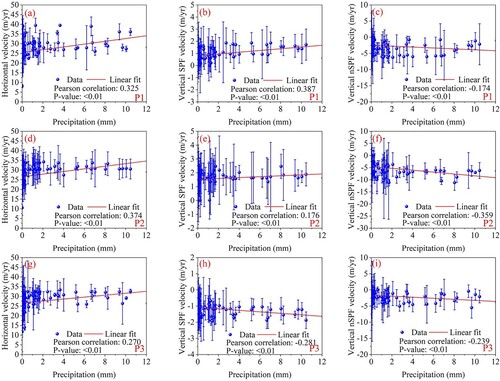
Figure 15. The statistical relationship between horizontal, vertical SPF, and nSPF velocities and air temperature at points P4 – P6 of the West Duosangpu Glacier.
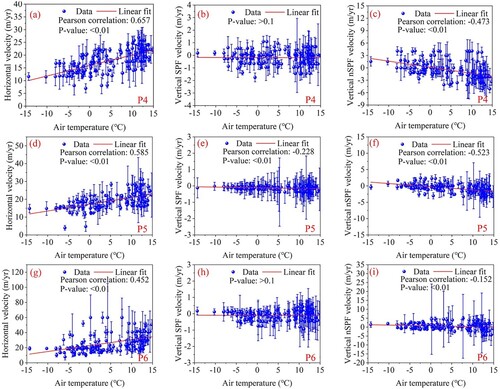
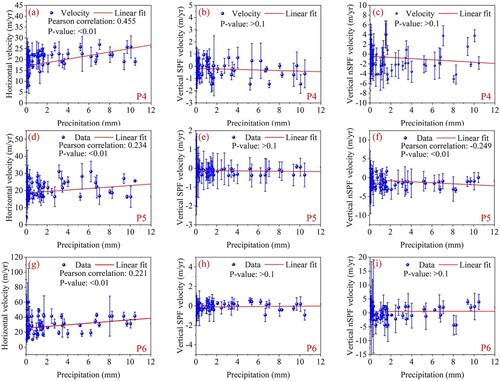
Figure 16. The statistical relationship between the 3D flow velocities and precipitation at points P4 – P6 of the West Duosangpu Glacier.