
Figures & data
Table I. Means, standard deviations, correlations and reliability coefficients among variables for typically developing children (n = 2890; below diagonal) and children with speech and language concern (SLC) (n = 1442; above diagonal).
Figure 1. Latent growth trajectory of average teacher–child closeness across waves for typically developing children and children with speech and language concern (SLC).
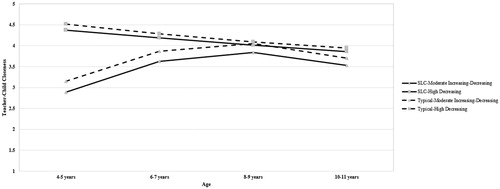
Figure 2. Latent growth trajectory of average teacher–child conflict across waves for typically developing children and children with speech and language concern (SLC).
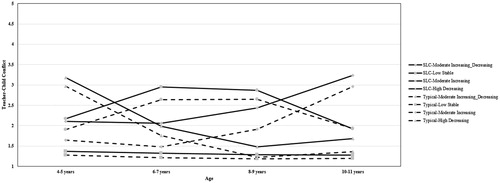
Table II. Within-group comparisons of teacher–child closeness trajectory classes on school academic and social-emotional outcomes.
Table III. Within-group comparisons of teacher–child conflict trajectory classes on school academic and social-emotional outcomes.