Figures & data
Table I. Outcome measurements used to evaluate intervention fidelity and child, educator, and environmental changes.
Table II. Participant and outcome overview (children).
Table III. Variance explained by fixed effects of time, educator, and lessons received.
Figure 1. Data collection flowchart.
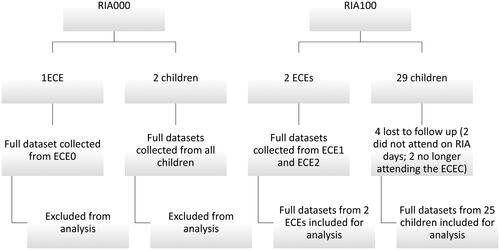
Figure 2. A to F: ggplot visualisations for phonological awareness skills (ECE1 on the left and ECE2 on the right; one Read It Again – KindergartenQ! lesson per week on top and two Read It Again – KindergartenQ! lessons per week on the bottom).
Note. Sseg = syllable segmentation; RA = rhyme awareness; AA = alliteration awareness; PI = phoneme identification; PS = phoneme segmentation; LK = letter knowledge.
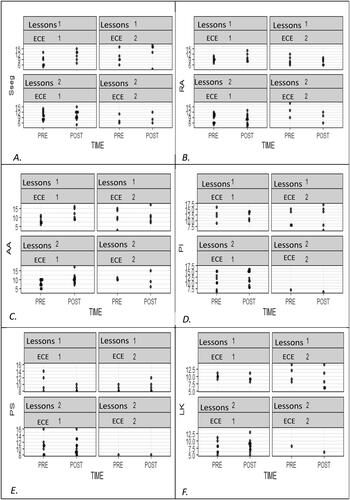
Figure 3. A to C: ggplot visualisations for narrative skills (ECE1 on the left and ECE2 on the right; one Read It Again – KindergartenQ! lesson per week on top and two Read It Again – KindergartenQ! lessons per week on the bottom).
Note. retell_perc = story retell percentage; comprehension = story comprehension score; generation = story generation score.
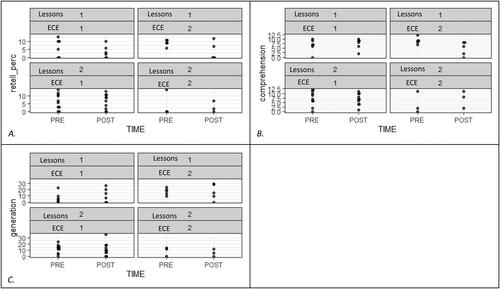
Figure 4. A to B: ggplot visualisations for print knowledge (ECE1 on the left and ECE2 on the right; one Read It Again – KindergartenQ! lesson per week on top and two Read It Again – KindergartenQ! lessons per week on the bottom).
Note. PKWA_raw = print knowledge and word awareness raw scores; PKWA_composite = print knowledge and word awareness composite scores.
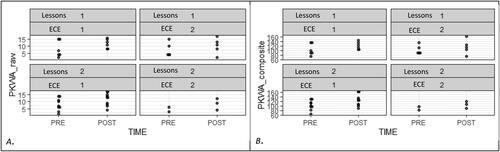
Figure 5. A–D: ggplot visualisations for expressive language skills (ECE1 on the left and ECE2 on the right; one Read It Again – KindergartenQ! lesson per week on top and two Read It Again – KindergartenQ! lessons per week on the bottom).
Note. utt_with_errors_perc = percent utterances with errors; MLU_morphemes = mean length of utterance in morphemes; NDW = number of different words; moving_average_NDW = moving average number of different words.
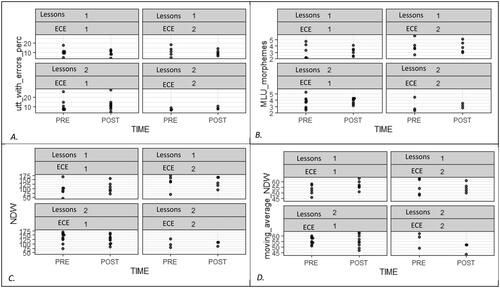
Figure 6. ECEs frequency of use of language and literacy promoting strategies pre- and post-intervention.
Note. ○ denotes statistically significant improvement for ECE1 from pre- to post-intervention; Δ denotes ECE1 was demonstrating significantly greater use of the strategy than ECE2 post-intervention.
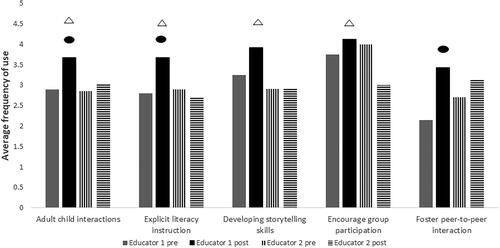
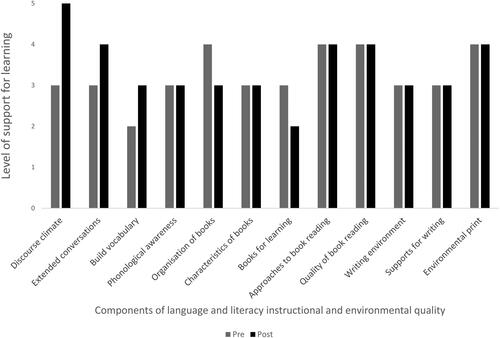
Figure 7. Dimensions of classroom environment and instructional quality pre- and post-intervention.