Figures & data
Figure 1. Locations of lake sediment records containing charcoal data within the Amazon basin sensu stricto, following (Eva et al. Citation2005). The sites containing charcoal data are shown in relation to dry season length; number of months receiving less than 100 mm precipitation (Berenguer et al. Citation2021). Study sites originally published by: Bush et al. (Citation1989), Behling (Citation2001), Behling and Lima Da Costa (Citation2000) Bush et al. (Citation2000) Bush et al. (Citation2007), Bush et al. (Citation2016), Irion et al. (Citation2006), Maezumi et al. (Citation2018b), Mayle et al. (Citation2000), McMichael et al. (Citation2012), Parsons et al. (Citation2018), Urrego et al. (Citation2013) Carson et al. (Citation2014), Brugger et al. (Citation2016), Taylor et al. (Citation2010), Nascimento et al. (Citation2019), De Toledo and Bush (Citation2007), Maezumi et al. (Citation2015), Cordeiro et al. (Citation2008), Behling and Da Costa (Citation2001), Kelly et al. (Citation2018), Maezumi et al. (Citation2018a).
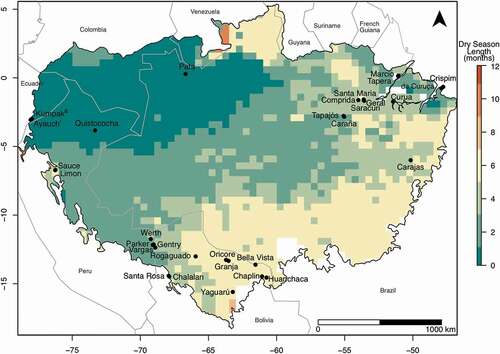
Figure 2. Charcoal data obtained from lake sediments from across the Amazon basin grouped by geographic region () and ordered top to bottom by dry season length (short to long). Width of bars indicates the temporal sampling resolution of each record. Grey X’s indicate samples analysed, i.e., grey X but no bar indicates no charcoal was found in the sample, no grey X indicates no sample examined/available. Size of charcoal fraction examined in each record indicated in microns (µm). Further, information on the type of charcoal data and the age vs. depth control can be found in the Online Supplementary Data Sheet. Early, Mid and Late notations below the time axis indicate the divisions of the Holocene following Walker et al. (Citation2019).
Figure 3. Composite fire histories for the north and north-western, south-western, and eastern Amazon Basin. Boxplots (quartiles; thick horizontal black bar, median; grey dot, mean; black dot, outliers) show the variation of charcoal abundance within 500-year time windows, and the number of records is shown above each time bin. Number of records available for each time bin indicated at the top of each panel (N =). See for the scaled charcoal data from individual sites within each region. Early, Mid and Late notations below the time axis indicate the divisions of the Holocene following Walker et al. (Citation2019).