Figures & data
Figure 1. Spatial map showing the known positions of SS El Faro and Hurricane Joaquin. The light blue diamond denotes positions of the vessel; the purple diamond denotes positions after flooding occurred; the pink diamond denotes positions after the vessel lost propulsion. The crosses show positions of Joaquin and the colour denotes the intensity: purple when Joaquin was a tropical storm; blue when Joaquin was a category 1 Hurricane; green when Joaquin was a category 2 Hurricane; yellow when Joaquin was a category 3 major Hurricane; red when Joaquin was a category 4 major Hurricane. The locations of Jacksonville, FL and San Juan, Puerto Rico are labelled as red circles. Image taken from Google.
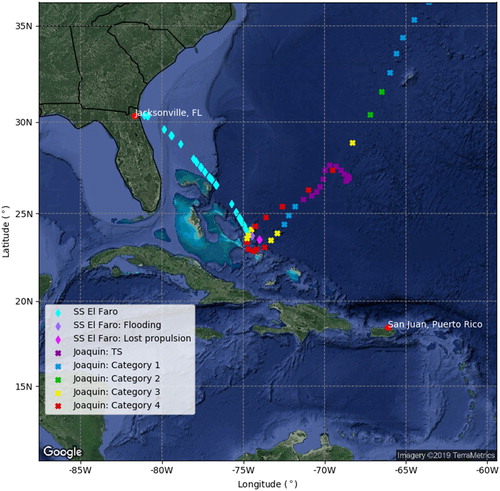
Figure 2. Speed over ground and course over ground of SS El Faro along its transit. The black vertical bars denote the time-period which is investigated in – as well as .
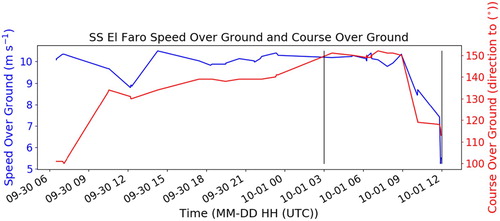
Figure 3. Annual surface current speed and direction climatology for the period 2000–2015. (a) HYCOM; (b) GDP; (c) HYCOM minus GDP.
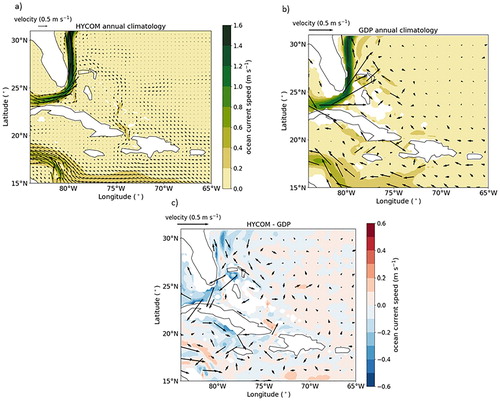
Figure 4. Annual 10-m wind speed climatology for the period 2000–2015. (a) ERA5; (b) Globwave; (c) ERA5 minus Globwave.
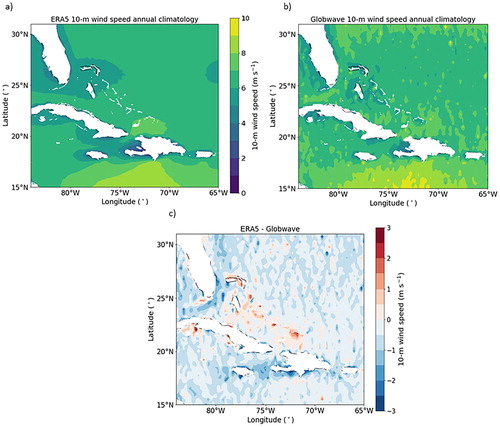
Figure 5. Annual significant wave height climatology for the period 2000–2015. (a) ERA5; (b) Globwave; (c) ERA5 minus Globwave.
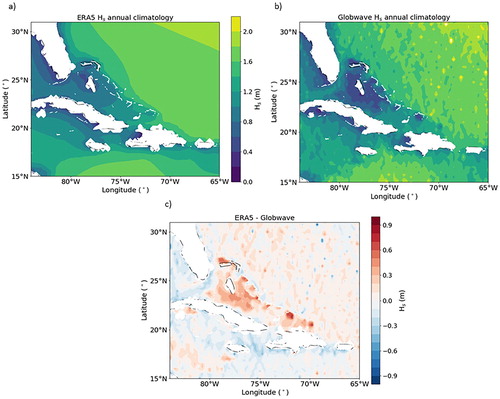
Figure 6. (a) HYCOM surface current speed and direction on 2015-10-01T12:00:00 UTC. The purple diamond is the last known position of SS El Faro given at 2015-10-01T11:56:07 UTC. The red cross is the location of Hurricane Joaquin on 2015-10-01T12:00:00 UTC. (b) HYCOM surface current speed and direction on 2015-10-01T12:00:00 UTC minus HYCOM climatology.
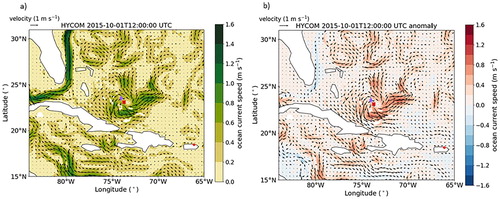
Figure 7. HYCOM ocean surface current speed and direction along the SS Faro track. The black vertical bars denote the time-period which is investigated in – as well as .

Figure 8. (a) ERA5 10-m wind speed and direction on 2015-10-01T12:00:00 UTC. The description of purple diamond and the red cross are given in . (b) ERA5 10-m wind speed and direction on 2015-10-01T12:00:00 UTC minus ERA5 climatology.
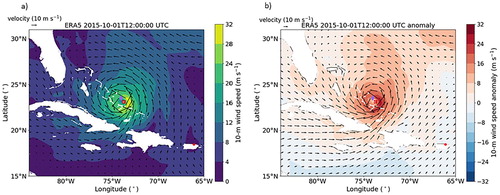
Figure 9 . ERA5 10-m wind speed and direction along the SS El Faro track. The black vertical bars denote the time-period which is investigated in – as well as .
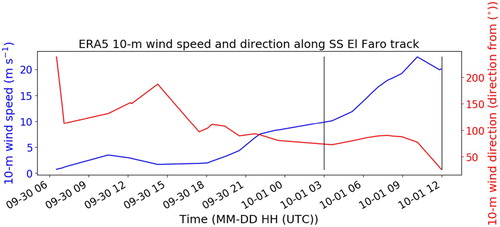
Figure 10. (a) ERA5 Maximum individual wave height and mean wave direction on 2015-10-01T12:00:00 UTC. The purple diamond and the red cross are given in . (b) ERA5 Maximum individual wave height and mean wave direction on 2015-10-01T12:00:00 UTC minus ERA5 climatology.
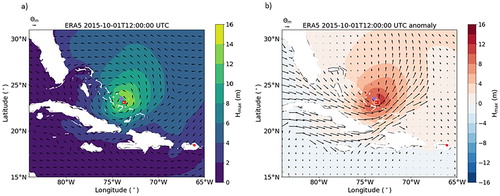
Figure 11 . (a) ERA5 Maximum individual wave height and mean wave direction along the SS El Faro track. (b) ERA5 period corresponding to maximum individual wave height and wave steepness along SS El Faro track. The black vertical bars denote the time-period which is investigated in – as well as .
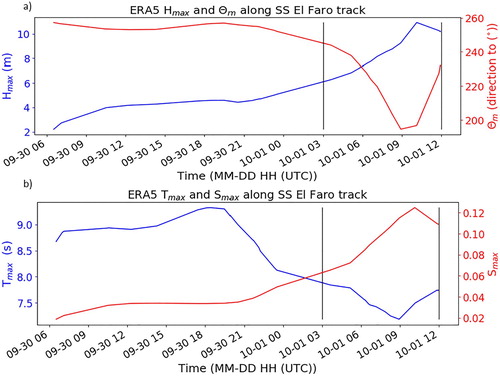
Figure 12. One-dimensional Ocean wave frequency spectra along the SS El Faro track. Four time periods are shown leading up to the last known location of SS El Faro on 2015-10-01T11:56:07 UTC. The time, latitude and longitude for the spectra are given in the legend.
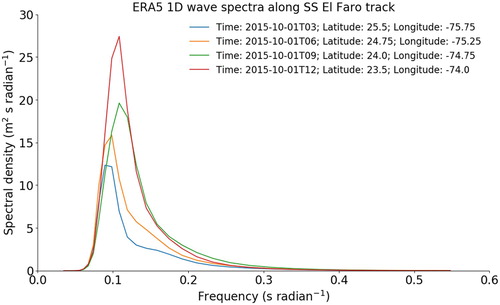
Figure 13. Two-dimensional ocean wave spectra. Each panel (a–d) corresponds to a time, latitude and longitude given in .
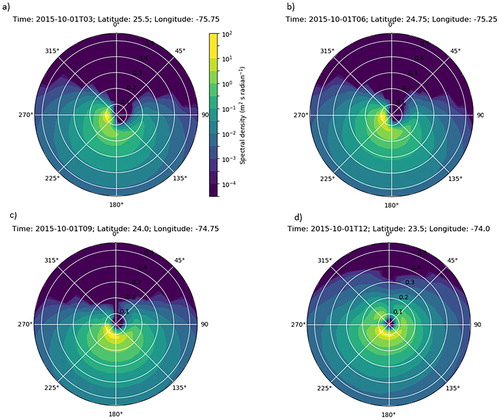
Table 1. Environmental parameters at the location of SS El Faro for the time periods 2015-10-01T03:00:00 UTC to 2015-10-01T12:00:00 UTC.
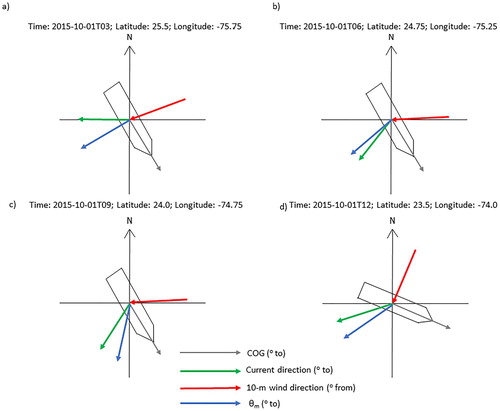
Figure 14. SS El Faro course over ground associated with the time and locations given in . The grey arrow indicates the course over ground; the green arrow denotes the ocean surface current direction. The red arrow shows the direction of the 10-m wind and the blue arrow denotes the mean wave direction.