
Figures & data
Figure 1. Our conceptual model for the interplay between biochar, the rhizosphere microbiome and the disease triangle. The vertices of the disease triangle include host susceptibility, pathogen virulence and environmental conditions. These are all influenced by the rhizosphere microbiome (depicted as a cloud with microbes). The ring represents the effects of biochar on this system. The various aspects related to biochar (adsorption, soil physical properties, toxins, redox, hormesis, nutrient supply, availability, etc.) can all influence factors of the disease triangle directly (depicted as the ring impinging on the vertices of the triangle) as well as indirectly through impacts on the rhizosphere microbiome (depicted as the ring impinging on the cloud representing the rhizosphere microbiome).
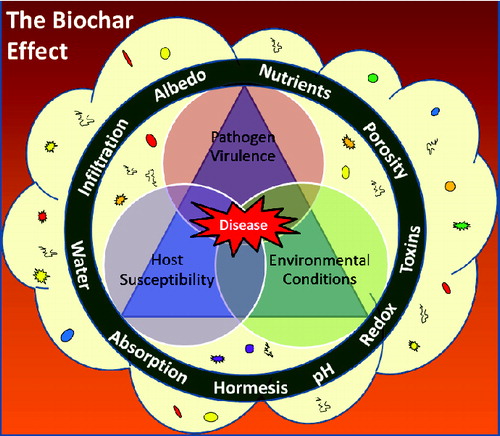
Table 1. Summary of studies investigating the effect of biochar on diseases caused by soilborne pathogens.
Figure 2. Effect of biochar produced from eucalyptus wood chips and greenhouse waste, both at a highest treatment temperature of 600°C at different concentrations (0, 0.5, 1 and 3% w/w) on (A) final damping-off, (B) area under mortality progress curve (AUMPC), (C) epidemic period and (D) disease severity in cucumber caused by Rhizoctonia solani. Columns labelled by a common capital letter and small letter are not significantly different at p < 0.05 according to Tukey-Kramer HSD test within eucalyptus wood chips and greenhouse waste biochars, respectively. Asterisk denotes the significant difference at p ≤ 0.05 according to Tukey-Kramer HSD test between feedstock at the same concentration. Bars = standard error. Reprinted from [6] with permission.
![Figure 2. Effect of biochar produced from eucalyptus wood chips and greenhouse waste, both at a highest treatment temperature of 600°C at different concentrations (0, 0.5, 1 and 3% w/w) on (A) final damping-off, (B) area under mortality progress curve (AUMPC), (C) epidemic period and (D) disease severity in cucumber caused by Rhizoctonia solani. Columns labelled by a common capital letter and small letter are not significantly different at p < 0.05 according to Tukey-Kramer HSD test within eucalyptus wood chips and greenhouse waste biochars, respectively. Asterisk denotes the significant difference at p ≤ 0.05 according to Tukey-Kramer HSD test between feedstock at the same concentration. Bars = standard error. Reprinted from [6] with permission.](/cms/asset/b52984d6-7e9d-4aca-9964-e61ad4ce4a83/tcmt_a_913360_f0002_b.gif)
Figure 3. Damping-off of cucumber caused by Rhizoctonia solani as a function of biochar concentration in the potting media. (A) Above-ground plants in media amended with 0, 0.5, 1, or 3% w/w biochar made from eucalyptus wood chips at a highest treatment temperature of 600°C (EUC-600), day 15 after infection. (B) Above-ground plants in media amended with 0, 0.5, 1, or 3% w/w biochar made from greenhouse waste (mainly pepper plants) at a highest treatment temperature of 600°C (GHW-600), day 15 after infection. (C) Roots of cucumber plants shown in panel B, day 20 after infection. Slanted line differentiates between roots from non-infected plants and roots from infected plants. From [113].
![Figure 3. Damping-off of cucumber caused by Rhizoctonia solani as a function of biochar concentration in the potting media. (A) Above-ground plants in media amended with 0, 0.5, 1, or 3% w/w biochar made from eucalyptus wood chips at a highest treatment temperature of 600°C (EUC-600), day 15 after infection. (B) Above-ground plants in media amended with 0, 0.5, 1, or 3% w/w biochar made from greenhouse waste (mainly pepper plants) at a highest treatment temperature of 600°C (GHW-600), day 15 after infection. (C) Roots of cucumber plants shown in panel B, day 20 after infection. Slanted line differentiates between roots from non-infected plants and roots from infected plants. From [113].](/cms/asset/359a5c76-0db3-4418-865d-9d27fefbafdb/tcmt_a_913360_f0003_c.jpg)
Figure 4. Per cent inhibition (–) or promotion (+) of radial mycelial growth of six soilborne pathogens (Pythium aphanidermatum, Sclerotium rolfsii, Verticillium dahliae, Macrophomina phaseolina, Fusarium oxysporum f. sp. melonis and Sclerotinia sclerotiorum) and one beneficial fungus (Trichoderma harzianum) as a function of biochar type and amount in the growing media as compared with biochar-free controls. Biochars were produced from two contrasting feedstocks (eucalyptus wood chips (EUC) and greenhouse waste (GHW)) at temperatures of 350°C and 600°C, respectively. Direct toxicity was studied using an in vitro contact assay to evaluate hyphal growth inhibition or promotion in growing media amended with varying concentrations of biochar (0, 0.5, 0.75, 1 and 3% w/v) and fortified with agar before autoclaving. Mycelial growth (in centimetres) was measured as the average of two perpendicular diameters of each thallus. The percentage growth inhibition (I, %) for treated (T) and control (C) was calculated as –[(C – T)/C] × 100. Standard deviation of three replicate plates is shown. Inverted red triangles designate treatments that were not significantly different from biochar-free controls at p ≤ 0.05 according to Tukey-Kramer (HSD) test. Detailed description of methodology, experimental design and statistical analysis is given in Supplemental data, which is available on the article's Taylor & Francis online page, at http://dx.doi.org/10.1080/17583004.2014.913360. Data from [113].
![Figure 4. Per cent inhibition (–) or promotion (+) of radial mycelial growth of six soilborne pathogens (Pythium aphanidermatum, Sclerotium rolfsii, Verticillium dahliae, Macrophomina phaseolina, Fusarium oxysporum f. sp. melonis and Sclerotinia sclerotiorum) and one beneficial fungus (Trichoderma harzianum) as a function of biochar type and amount in the growing media as compared with biochar-free controls. Biochars were produced from two contrasting feedstocks (eucalyptus wood chips (EUC) and greenhouse waste (GHW)) at temperatures of 350°C and 600°C, respectively. Direct toxicity was studied using an in vitro contact assay to evaluate hyphal growth inhibition or promotion in growing media amended with varying concentrations of biochar (0, 0.5, 0.75, 1 and 3% w/v) and fortified with agar before autoclaving. Mycelial growth (in centimetres) was measured as the average of two perpendicular diameters of each thallus. The percentage growth inhibition (I, %) for treated (T) and control (C) was calculated as –[(C – T)/C] × 100. Standard deviation of three replicate plates is shown. Inverted red triangles designate treatments that were not significantly different from biochar-free controls at p ≤ 0.05 according to Tukey-Kramer (HSD) test. Detailed description of methodology, experimental design and statistical analysis is given in Supplemental data, which is available on the article's Taylor & Francis online page, at http://dx.doi.org/10.1080/17583004.2014.913360. Data from [113].](/cms/asset/67670cd1-ddca-4422-8096-86276b100784/tcmt_a_913360_f0004_c.jpg)