
Figures & data
Table 1. Annual exogenous and plant-mediated C input in a rice–wheat system in unamended control plots and plots amended with fertilizer NPK, farmyard manure (FYM), vermicompost (VC), rice straw compost (RSC) and NPK plus FYM (INM). Numbers in parentheses indicate standard error.
Table 2. Chemical composition of farmyard manure (FYM), vermicompost (VC) and rice straw compost (RSC). Numbers in parentheses indicate standard error.
Figure 1. Carbon accumulation (over fertilizer NPK) in soil at different profile depths after 10 years of management with farmyard manure (FYM), vermicompost (VC), rice straw compost (RSC) and integrated use of NPK and FYM (INM) and unamended control in a rice–wheat system. Vertical line bars show standard error. Bars labeled with different letters indicate significant (p < 0.05) difference by Duncan’s multiple range test.
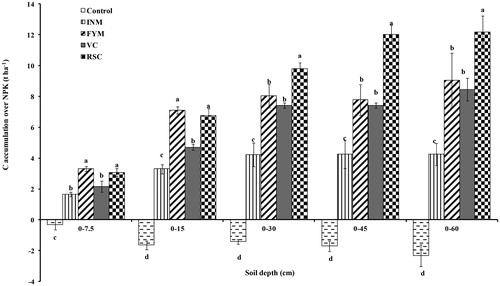
Table 3. Soil organic carbon (SOC) concentration, bulk density and C stocks in the 60-cm profile after 10 years in a rice–wheat system in unamended control plots and plots amended with fertilizer NPK, farmyard manure (FYM), vermicompost (VC), rice straw compost (RSC) and NPK plus FYM (INM). Numbers in parentheses indicate standard error.
Figure 2. Response of coarse particulate (cPOC), fine particulate (fPOC) and mineral-associated organic C (MinOC) in 0–7.5 and 7.5–15 cm soil depths to 10 years management with farmyard manure (FYM), vermicompost (VC), rice straw compost (RSC), integrated use of NPK and FYM (INM) and unamended control compared to fertilizer NPK in rice–wheat system. Vertical line bars indicate standard error. Bars with different letters differ significantly (p < 0.05) by Duncan’s multiple range test.
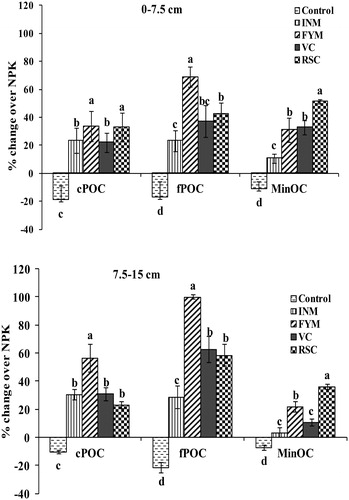
Figure 3. Influence of 10 years of management with fertilizer NPK, farmyard manure (FYM), vermicompost (VC), rice straw compost (RSC), integrated use of NPK and FYM (INM) and unamended control in a rice–wheat system on distribution of soil organic C among physical pools, viz. coarse particulate (cPOC), fine particulate (fPOC) and mineral-associated organic C (MinOC), as proportion of soil organic C in 0–7.5 and 7.5–15 cm soil depths. Numbers inside the bars labeled with different letters for a given pool indicate significant (p < 0.05) differences between treatments by Duncan’s multiple range test. Vertical line bars show standard error.
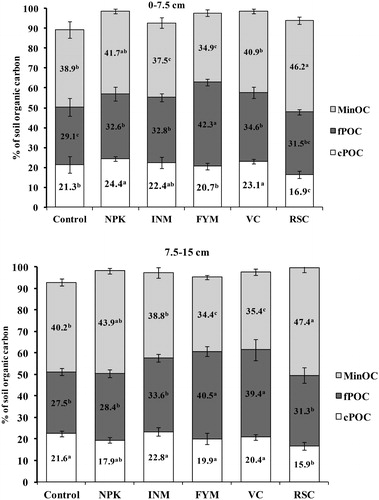
Table 4. Non-hydrolyzable carbon (NHC) in 0–7.5 and 7.5–15 cm soil depths after 10 years in a rice–wheat system in unamended control plots and plots amended with fertilizer NPK, farmyard manure (FYM), vermicompost (VC), rice straw compost (RSC) and NPK plus FYM (INM). Numbers in parentheses indicate standard error.
Figure 4. Temporal trends of C mineralization in soils drawn from field plots (0–7.5 cm and 7.5–15 cm depth) amended with fertilizer NPK, farm yard manure (FYM), vermicompost (VC), rice straw compost (RSC), integrated use of NPK and FYM (INM) and unamended control for 10 years in a rice–wheat system. Points represent measured C mineralization and lines are fitted to the first-order kinetics model. Vertical line bars on points indicate standard error. Vertical line bars on the X-axis indicate least significant difference (p < 0.05) values for each sampling day.
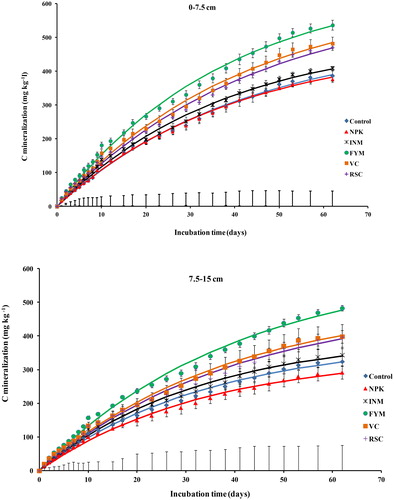
Figure 5. Relationship between C mineralization potential (C0) and coarse particulate (cPOC), fine particulate (fPOC) and mineral-associated organic C (MinOC) in 0–7.5 and 7.5–15 cm soil depths.
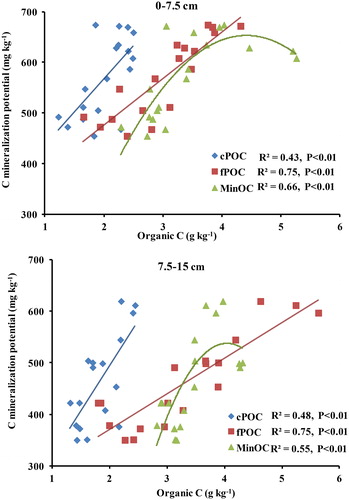
Table 5. Parameter (C0 and k) estimates for the first-order kinetic model (Equation 3) fitted to cumulative carbon mineralization (Cmin) vs. time data for 0–7.5 and 7.5–15 cm soil depths in unamended control and plots amended with fertilizer NPK, farmyard manure (FYM), vermicompost (VC), rice straw compost (RSC) and NPK plus FYM (INM).