
Figures & data
Figure 1. Base map of farm trial sites (Source: Google Maps [Citation44]).
![Figure 1. Base map of farm trial sites (Source: Google Maps [Citation44]).](/cms/asset/31cc99ed-8cd0-42d9-8043-f052ff5b71ac/tcmt_a_1835387_f0001_c.jpg)
Table 1. Details of experimental treatments.
Table 2. Coefficients used for preparation of emissions inventory from crop residue burning.
Table 3. Emission coefficients for residue burning of various crops.
Table 4. Lower heating value of various crop residues.
Table 5. Maximum crop residue load recorded in farmers’ fields before straw burning.
Table 6. Emissions of greenhouse gas and air pollutants from burning of rice and wheat crop residues in farmers’ fields (values are sums of residues from five farmers).
Figure 2. Theoretical energy potential (TEP) of crop residue burning under farmers’ practice.
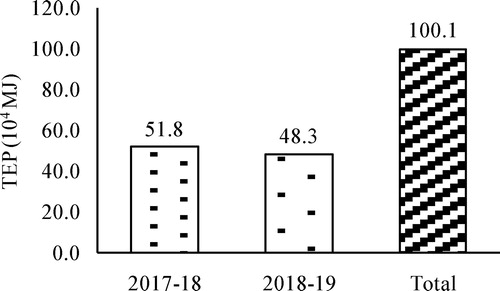
Figure 3. Two year pooled weed density and weed dry biomass under various crops.
FP - Farmer Practice; CAW - Conservation agriculture with improved weed management practices; CA - Conservation agriculture without any weed management practices; no. - number; g - gram; sq. m - square meter
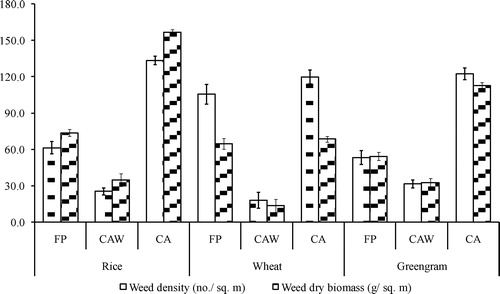
Table 7. Weed parameters observed under different treatments.
Figure 4. Weed control efficiency (WCE) of recommended herbicides in various crops.
FP - Farmer Practice; CAW - Conservation agriculture with improved weed management practices; WCE - Weed control efficiency
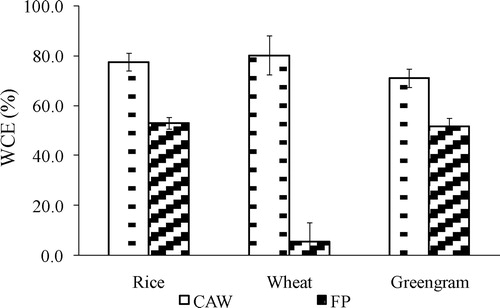
Table 8. Crop yield parameters under different treatments.
Figure 5. Percentage reduction in crop yields under farmers’ practice (FP) over conservation agriculture with improved weed management practices (CAW).
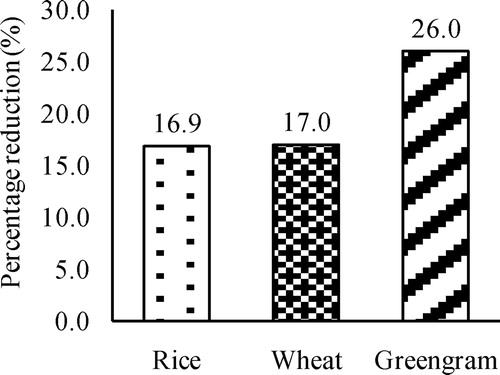
Table 9. Economic analysis of the cropping systems.