Figures & data
Figure 1. Variables, quality aspects and general index considered in the study.
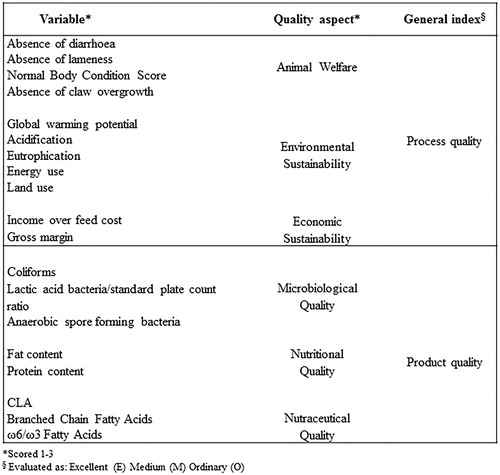
Figure 2. Frequency distribution of CLA variable and identification of percentiles for the allocation to the 3-level rescaled variable.
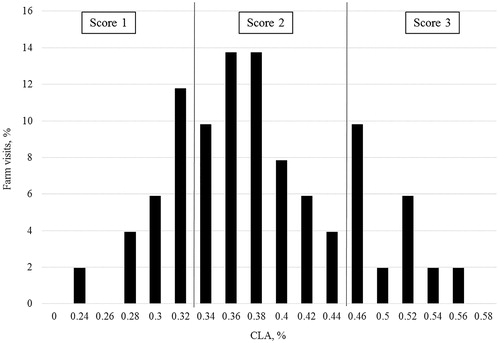
Table 1. Average characteristics of the farms involved in the study.
Table 2. Mean values and percentile of the variables chosen to define quality aspects.
Table 3. Process quality index level (excellent, medium and ordinary): average characteristics of the observations.
Table 4. Product quality index level (excellent, medium and ordinary): average characteristics of the observations.
Figure 3. Farm quality evaluation on the basis of dairy efficiency (kg FPCM/kg DMI).
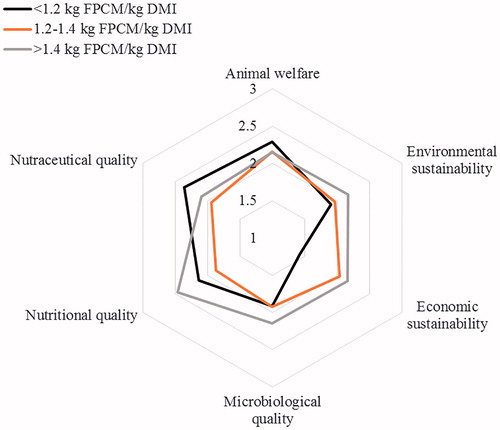
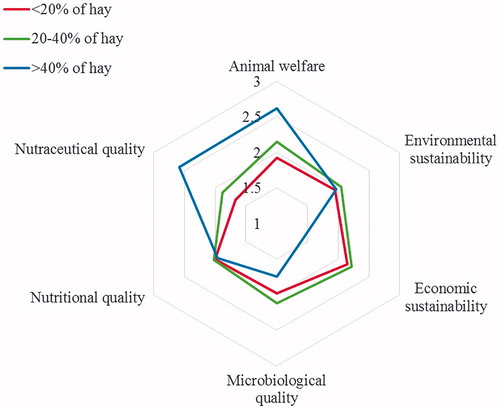
Figure 4. Quality evaluation on the basis of the percentage of hay in the lactating cows’ ration (% of DMI).