
Figures & data
Table 1. The chemical composition of the forages and the concentrate and protein block fed for supplementation.
Table 2. Cumulative gas produced at different times of incubation for forages and parameters of gas production estimated with the exponential model, in vitro organic matter digestibility and metabolisable energy.
Figure 1. In vitro gas production profiles of the forages. Gas production profiles have been fitted to curves using the equation y = B (1 − e–c(t – lag)); B, the asymptotic gas volume; c, the rate constant, lag, the time between inoculation and commencement of gas production.
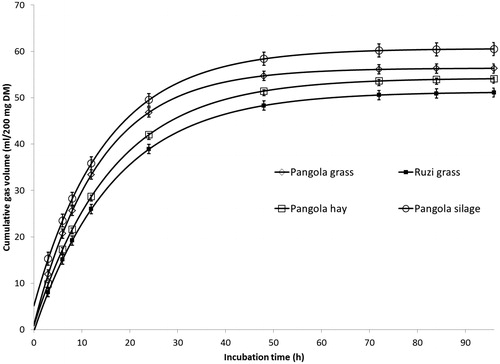
Table 3. The in vivo nutrient digestibility (%) and concentration of metabolisable energy (ME) of the different diets (forages supplemented with concentrate and protein block).
Table 4. Dry matter intake, body weight gain and average daily gain of native White Lamphun bulls fed on diets with different forages supplemented with concentrate and protein block (values represent least squares means and standard error of the means (SEM)).