
Figures & data
Table 1. Chemical composition (±standard deviation) of selected forages in g/kg dry matter (DM), unless stated otherwise.
Figure 1. (a) (upper). Forage composition according to forage type (FG: fresh grass; GS: grass silage; HA: hay from permanent grassland; MS: maize silage; CL: clover; AL: alfalfa; ST: straw). Forage type: Diets, which consisted of an above-average proportion of one of the above-named forage components, were encoded as ‘based on the respective forage’. The respective codes from each record were combined and resulted in the presented forage types. The grouping of forage type is based on the individual diet composition at each performance recording (N = 38,070). (b). Forage composition according to feeding system. The feeding system describes how diets and especially concentrates were fed (FOR: pure forage diet; SEP: forage diet with separately supplemented concentrate; PMR: partial mixed ration; TMR: total mixed ration). The grouping of feeding system is based on the individual diet composition at each performance recording (N = 38,070).
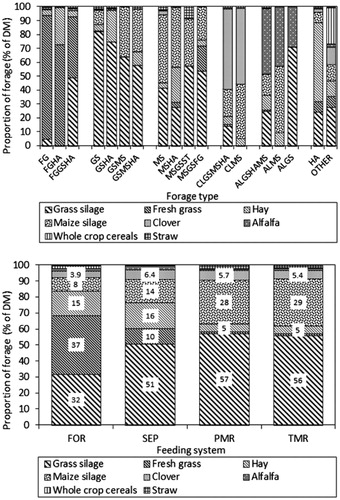
Table 2. Distribution of records, cows and farms in forage types.
Table 3. Distribution of records, cows and farms in feeding systems.
Table 4. Data distribution of genotypes in feeding systems.
Table 5. Effect of genotype and parity on estimated daily feed and nutrient intake, chemical composition of diet and body weight, body condition score and milk yield (least squares means).
Figure 2. Interaction between genotype and lactation stage for dry matter intake (DMI, BW0.75: metabolic body weight), neutral detergent fibre (NDF) intake, concentrate proportion, energy corrected milk (ECM) and body condition score (BCS) of Brown Swiss (BS), Fleckvieh (FV), the selected FV groups with increasing Red Holstein (RH) genes FV × RH25 and FV × RH5075 as well as Holstein Friesian (HF).
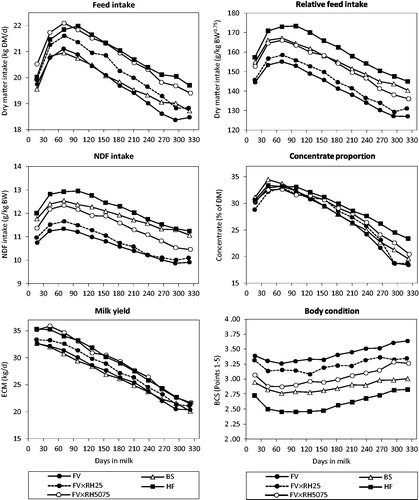
Table 6. Effect of stage of lactation on estimated daily feed and nutrient intake, chemical composition of diet and body weight, body condition score and milk yield (least squares means).