
Figures & data
Table 1. Feed ingredient and chemical composition (mean ± SE) of the solid feeds provided to the calves during the fattening cycle in the two farms.
Table 2. Description of the animal-based measures used in the assessment protocol for the in vivo examination of calves’ health status during the week before the beginning of the experimental differentiation of the number of solid feed distributions, and 1, 2, and 3 months after the beginning of the experimental differentiation of the number of solid feed distributions.
Figure 1. Prevalence of veal calves observed with bloated rumen (Least square means ±95% confidence intervals) (top figures) and haemoglobin concentration (Least square means ± SEM) (bottom figures) according to the interaction between treatment and observation or blood sampling day (left figures) and between farm and observation or blood sampling day (right figures). Different letters (A–C) indicate significant differences for observation or sampling day (p <.001). Different letters (X–Z) indicate a significant farm × blood sampling day interaction (p <.001).
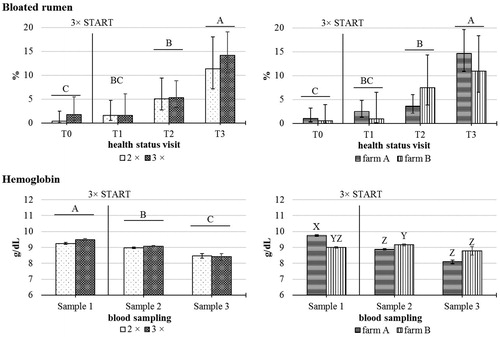
Table 3. Least means and 95% confidence intervals of prevalence of veal calves observed with health status problems during the four health status observation days according to the number of daily solid feed distributions (2× and 3×) and to the farm (A and B).
Figure 2. Effect of treatment × time from milk-replacer distribution interaction on the percentage of veal calves observed in standing posture, eating solid feed or performing non-nutritive oral behaviour during the three 5-h behavioural observation sessions (Least square means ± SEM). Different letters indicate significant differences within a given behaviour (p <.05 lower case; p <.001 capital letters). 1° SFD: 1st solid feed distribution for all calves; 2° SFD: 2nd solid feed distribution only for calves receiving three daily doses of solid feed.
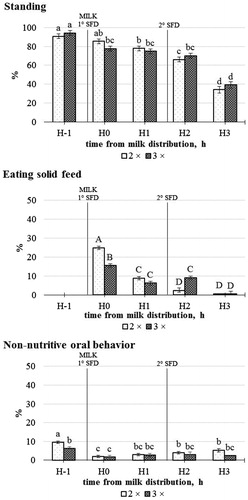
Table 4. Post mortem rumen and abomasal mucosa evaluations (mean ± SE) carried out at the slaughterhouse according to the number of daily solid feed distributions (2× and 3×) and to the farm (A and B).