
Figures & data
Table 1. Ingredients, proximate composition and fatty acid profile of the experimental diets.
Table 2. Proximate composition (g/kg meat) of longissimus thoracis muscle of Piemontese bulls fed the control (C) and flaxseed (FS) diets (n = 9).
Table 3. Fatty acid profile of total lipids in longissimus thoracis muscle of Piemontese bulls fed the control (C) and flaxseed (FS) diets (n = 9).
Table 4. Thiobarbituric acid reactive substances (TBARS; mg MDA/kg of muscle tissue) values of longissimus thoracis muscle of Piemontese bulls fed the control (C) and flaxseed (FS) diets (n = 9), during ageing (2, 7 and 10 days at 4 ± 1 °C).
Table 5. Colour parameters of longissimus thoracis muscle of Piemontese bulls fed the control (C) and flaxseed (FS) diets (n = 9) during ageing (7 and 10 days at 4 ± 1 °C).
Figure 1. Sensory ratings distribution of flavour intensity. Flavour was evaluated on a 9-point, end-anchored, intensity scale, where 1 = ‘none or extremely bland’; 9 = ‘extremely intense’.
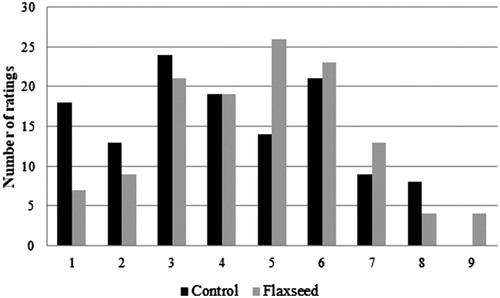
Table 6. Flavour intensity of longissimus thoracis muscle of Piemontese bulls fed the control (C) and flaxseed (FS) diets (n = 9).
Table 7. Flavour acceptability of longissimus thoracis muscle of Piemontese bulls fed the control (C) and flaxseed (FS) diets.