
Figures & data
Table 1. Sample set.
Table 2. Instrumental specifications and operating parameters.
Table 3. Sugars content of the different honey varieties.
Table 4. Measured pH values.
Figure 1. Spider chart obtained with the intensity of the E-tongue’ potentiometric sensors (Colour). (Colour online.)
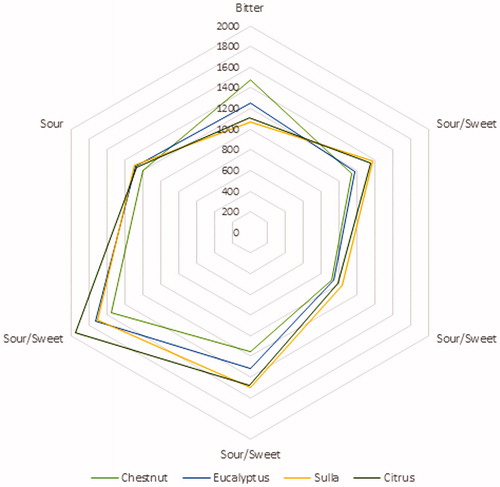
Figure 2. Graphs showing the percentage abundance of the extracted colours within (a) Chestnut honeys, (b) Eucalyptus honeys, (c) Sulla honeys and (d) Citrus honeys (Colour). (Colour online.)
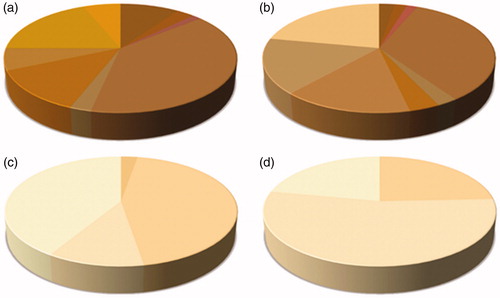
Table 5. Minerals content.
Table 6. Relationship between colour and mineral content.