
Figures & data
Table 1. Chemical composition and energy value in Femoral biceps of Sarda suckling lambs in different slaughter months.
Table 2. Fatty acid profile (g/100 g of FA) of intramuscular fat in Femoral biceps muscle of Sarda suckling-lambs in different slaughter months.
Table 3. Partial sums of fatty acids (% of total FA) of intramuscular fat of Femoral biceps of Sarda suckling-lambs in different slaughter months.
Figure 1. Correlation between 18:2 c-9,t-11 (CLA) and 18:1 t-11 in Femoral biceps muscle of Sarda suckling lambs reared in different months (from December to April) in Sardinia (Italy).
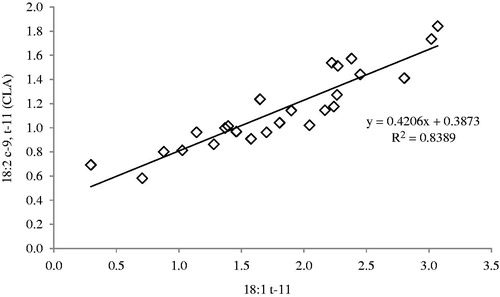
Table 4. Content of fatty acid groups and nutritionally important fatty acids (mg/100 g of meat) in Femoral biceps muscle of Sarda suckling-lambs in different slaughter months.