Figures & data
Table 1. Composition of the experimental diets.
Table 2. Oligonucleotides used for expression analysis of chicken genes and the annealing temperatures (AT).
Table 3. Least squares mean for broiler initial body, final body, hot carcase and cold carcase weights and dressing percentages as affected by strain.
Table 4. Least squares mean for carcase cuts and abdominal fat percentages as affected by strain (percentages expressed as a part of cold carcase weight).
Table 5. Least squares mean for non-carcase components as affected by strain (percentages expressed as a part of cold carcase weight).
Table 6. Least squares means for meat quality parameters as affected by strain.
Figure 1. Growth and consumption parameters of tested broiler strains during four weeks of experimentation. Data presented as LSMeans ± SE. Means without a common superscript differ significantly (p ≤ .05); *means differ significantly (p < .05, see text).
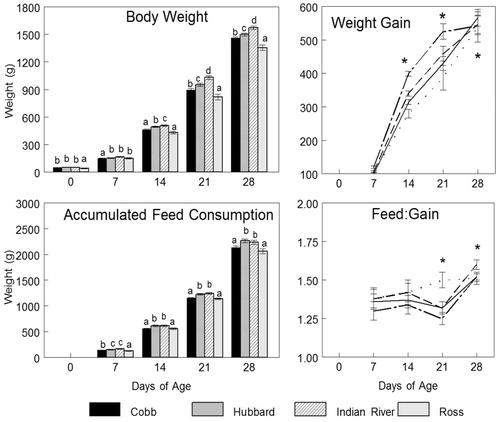
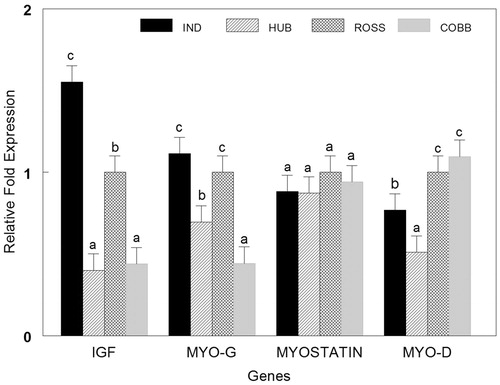
Figure 2. Normalized fold expression of IGF-I, MYO-D, MYO-G and MSTN genes in four broiler strains (IND: Indian River, HUB: Hubbard, Cobb 500, Ross 308). Different letters (a, b, c, d) indicate significant difference among strains.