Figures & data
Table 1. Chemical composition, pre-ensiled characteristics and bacterial population of raw materials.
Table 2. Effect of additives and ensiling days on pH, organic acids and ethanol composition of rice straw silage.
Figure 1. V-score of 60-day rice straw silage (n = 5, bars indicate standard error of the means). Control, no additive; 2%M, 2% molasses; 3%M, 3% molasses; 4%M, 4% molasses; 0.02%E, 0.02% fibrolytic enzyme; 0.04%E, 0.04% fibrolytic enzyme; 0.06%E, 0.06% fibrolytic enzyme. Means with different small letters shows significant differences among treatments at p < .05.
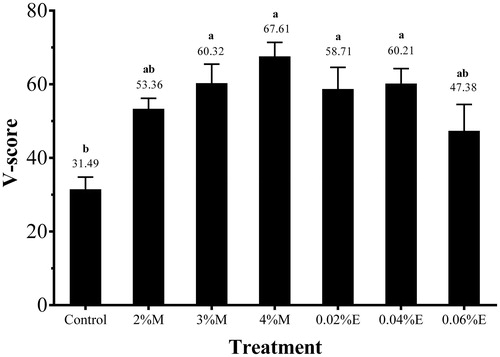
Table 3. Effect of additives and ensiling days on dry matter, dry matter loss and NH3-N content of rice straw silage.
Table 4. Effect of additives and ensiling days on structural carbohydrates composition of rice straw silage.
Figure 2. Dynamic changes of (A) water soluble carbohydrates, (B) glucose, (C) fructose and (D) xylose during fermentation with different treatments (n = 5, bars indicate standard error of the means). Control, no additive; 2%M, 2% molasses; 3%M, 3% molasses; 4%M, 4% molasses; 0.02%E, 0.02% fibrolytic enzyme; 0.04%E, 0.04% fibrolytic enzyme; 0.06%E, 0.06% fibrolytic enzyme. Treatments, ensiling days and their interaction were significant at p < .05.
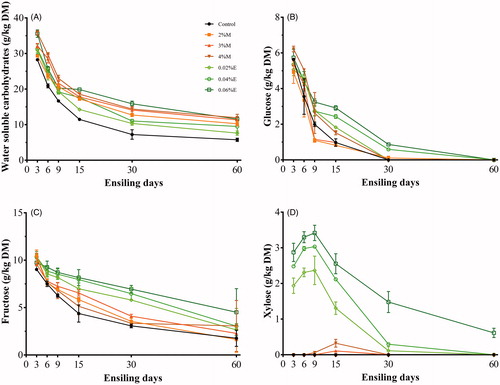
Table 5. Crude protein, crude ash, gas production kinetics and in vitro degradability of rice straw silage after 60 days of ensiling.
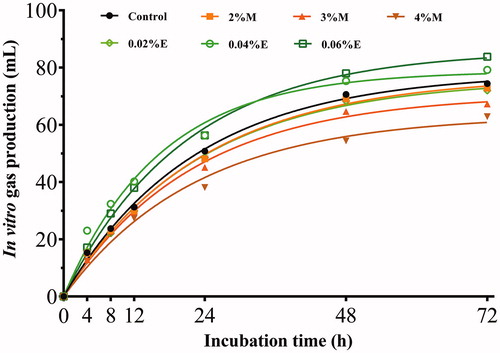
Figure 3. Gas production profiles (mL/g DM) from in vitro fermentation of rice straw silage for 72 h (n = 5). DM: dry matter; Control, no additive; 2%M, 2% molasses; 3%M, 3% molasses; 4%M, 4% molasses; 0.02%E, 0.02% fibrolytic enzyme; 0.04%E, 0.04% fibrolytic enzyme; 0.06%E, 0.06% fibrolytic enzyme. Treatments, incubation time and their interaction were significant at p < .05.