
Figures & data
Table 1. Descriptive statistics (SD between brackets) of productive traits, and milk and cheese composition of sampled cows according to different dairy systems.
Table 2. Correct classification (% average of 10-fold cross-validation) of the linear discriminant analysis (LDA) based on volatile organic compounds of cheeses measured by PTR-ToF-MS to authenticate the dairy systems.
Table 3. Variance explained by each linear discriminant function (LD) of the 12 analyses (LDA) according 3 or 5 dairy systems.
Figure 1. Bi-plot score of the linear discriminant functions (LD1; LD2) obtained using the full data set (All) including the 1,075 cows (a) and 72 herds (b) as observation and the spectrometric peaks that characterised the volatile profile of individual model cheeses as variables. The cows and the herd are classified in three dairy systems.
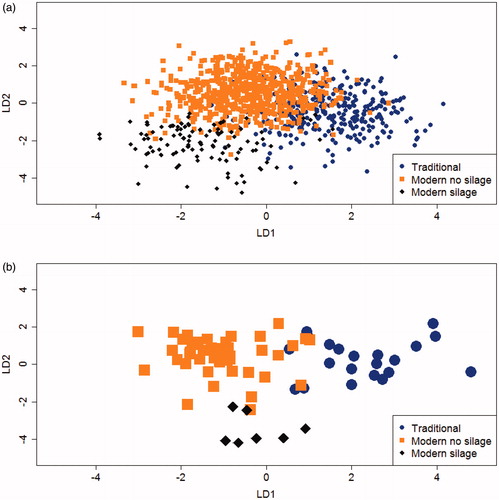
Figure 2. Bi-plot score of the linear discriminant functions (LD1; LD2) obtained using the full data set (All) including the 1,075 cows (a) and 72 herds (b) as observations and the spectrometric peaks that characterised the volatile profile of individual model cheeses as variables. The cows and the herds are classified in five dairy systems. Traditional: cluster of herds composed by traditional dairy systems without and with AF (Automatic Feeders at mangers to control individually concentrate distribution); Modern no silage: cluster of herds composed by modern dairy systems with hay plus compounds feed and modern TMR (total mixed ration) no silage; Modern silage: cluster of herds that used TMR and corn silage; CF: compounds feed.
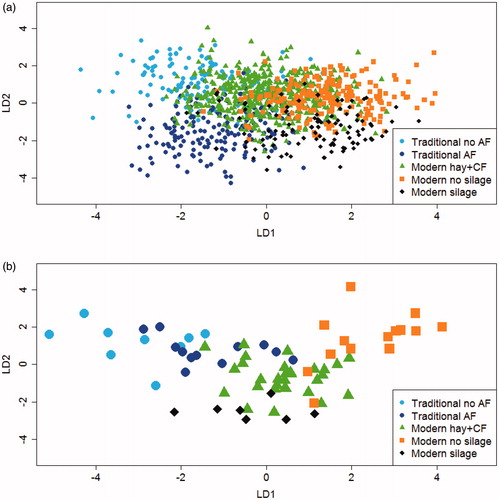
Table 4. Coefficients in the linear discriminant function (LD) of the 12 analyses (LDA) and average content for the most discriminant spectrometric peaks (having coefficients >0.35) of the 1,075 model cheeses (cows) belonging to 3 and 5 dairy systemsCitationa.