Figures & data
Table 1. Description of attributes and associated scales’ anchor points used for sensory evaluation of sausage samples.
Table 2. Growth potential (δ, log CFU/g) and significative interaction (p < .001) of protective culture presence (PC + and PC–) and temperature (abusive temperatures and control refrigerated conditions) at different sampling times on Listeria monocytogenes mean counts (log CFU/g) of experimental sausages.
Figure 1. Evolution of bacterial counts (log CFU/g, mean ± SD) at different sampling times (t0, t3, t7 and t9, days) of experimental sausages, with (PC+) and without (PC–) protective culture, stored at 7 °C. In case of significant interaction (PC × Time), different letters show statistically significant differences among samples.
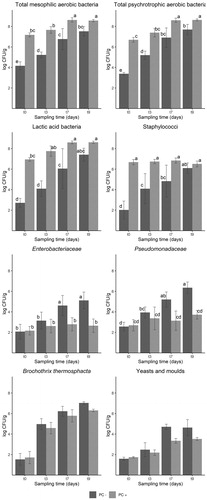
Figure 2. Evolution of pH values and TBARS content (mg/kg of malondialdehyde, MDA, mean ± SD) at different sampling times of experimental sausages, with (PC+) and without (PC–) protective culture, stored at 7 °C. In case of significant interaction (PC × Time), different letters show statistically significant differences among samples.
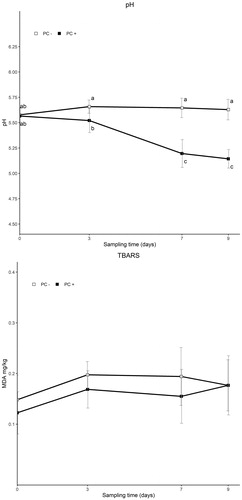
Table 3. External and internal mean colour parameters at different sampling times (t0, t3, t7 and t9, days) of experimental sausages, with (PC+) and without (PC–) protective culture, stored at 7 °C.
Figure 3. Evolution of sensory parameters of raw experimental sausages, with (PC+) and without (PC–) protective culture, stored at 7 °C at different sampling times, grouped by presence of protective culture and sampling time. *Statistically significant differences (p < .05).
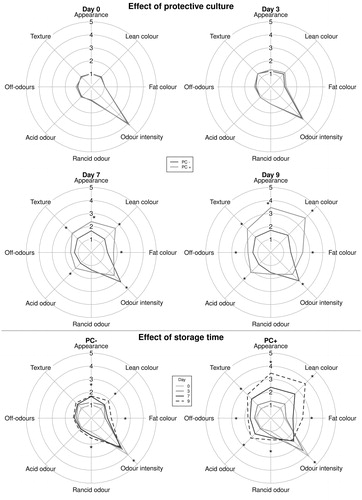
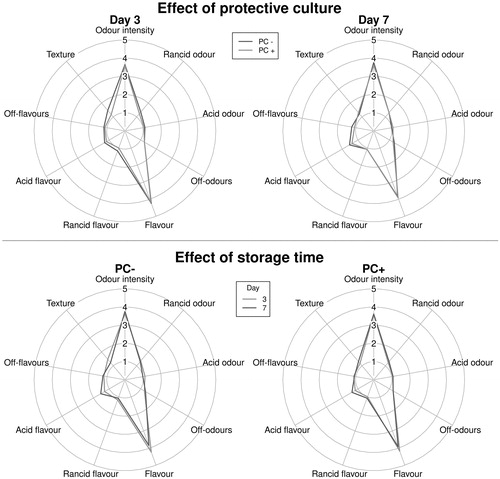
Figure 4. Evolution of sensory parameters of cooked experimental sausages, with (PC+) and without (PC–) protective culture, stored at 7 °C at different sampling times, grouped by presence of protective culture and sampling time. *Statistically significant differences (p < .05).