
Figures & data
Table 1. Ingredient and nutrient composition of basal diets.
Table 2. Chemical composition of the supplements used in the experiment.
Table 3. Productive performance (14–42 days).
Figure 1. a,b,c. Effect of dietary OP and GP supplements on energetic parameters from blood serum (ml/dl). Where: a, bMeans within a row with no common superscript differ (P< 0.05). C = control diet; OP = control diet supplemented with orange peel; GP= control diet supplemented with grapefruit peel.
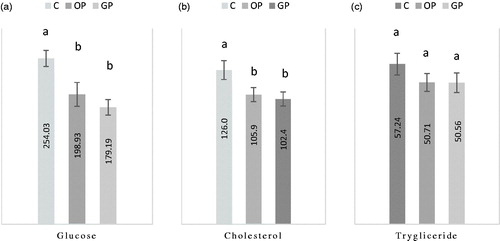
Table 4. Fatty acids composition in thigh meat.
Figure 2. Effect of dietary OP and GP supplements on TBARS concentration evolution in time (0 and 7 days). Where: a, b, cMeans within a row with no common superscript significantly differ (p < 0.05). C = control diet; OP = control diet supplemented with orange peel; GP = control diet supplemented with grapefruit peel.
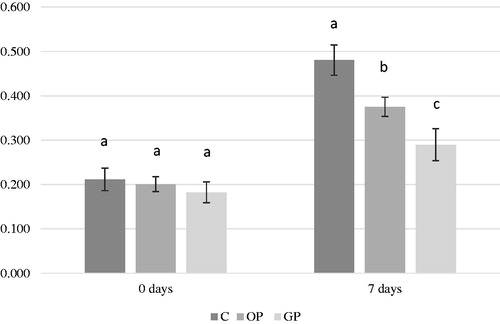
Table 5. Effect of OP and GP on broilers intestinal microbial population from small intestine and caecum (log 10).