Figures & data
Table 1. Basal diet composition (as-fed basis).
Figure 1. The ambient temperature and relative humidity during experimental period.
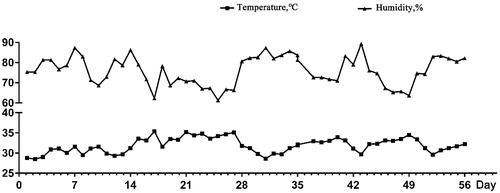
Table 2. Effects of chitosan oligosaccharides on growth performance of broilers under high ambient temperature.
Figure 2. Effects of chitosan oligosaccharides (COS) on serum alanine aminotransferase (ALT) and aspartate aminotransferase (AST) in yellow-feather broilers under high ambient temperature. Control group, basal diet; COS100 group, basal diet with 100 mg/kg COS; COS200 group, basal diet with 200 mg/kg COS. Values are mean ± standard error of mean. The values have different superscript letters are different (p < .05).
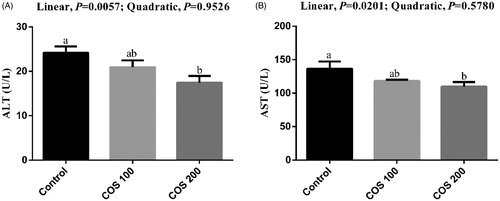
Figure 3. Effects of chitosan oligosaccharides (COS) on anti-oxidant status in serum of yellow-feather broilers under high ambient temperature. Control group, basal diet; COS100 group, basal diet with 100 mg/kg COS; COS200 group, basal diet with 200 mg/kg COS. MDA: malondialdehyde; SOD: superoxide dismutase; GSH-Px: glutathione peroxidase; CAT: catalase. Values are mean ± standard error of mean. The values have different superscript letters are different (p < .05).
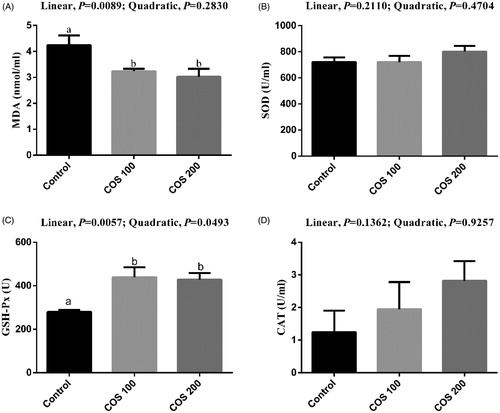
Figure 4. Effects of chitosan oligosaccharides (COS) on anti-oxidant status in liver of yellow-feather broilers under high ambient temperature. Control group, basal diet; COS100 group, basal diet with 100 mg/kg COS; COS200 group, basal diet with 200 mg/kg COS. MDA: malondialdehyde; SOD: superoxide dismutase; GSH-Px: glutathione peroxidase; CAT: catalase. Values are mean ± standard error of mean. The values have different superscript letters are different (p < .05).
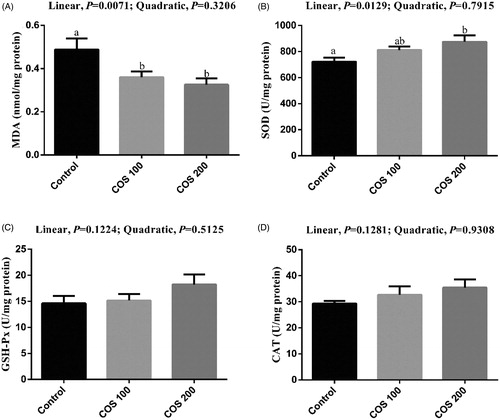
Figure 5. Effects of chitosan oligosaccharides (COS) on anti-oxidant status in spleen of yellow-feather broilers under high ambient temperature. Control group, basal diet; COS100 group, basal diet with 100 mg/kg COS; COS200 group, basal diet with 200 mg/kg COS. MDA: malondialdehyde; SOD: superoxide dismutase; GSH-Px: glutathione peroxidase; CAT: catalase. Values are mean ± standard error of mean. The values have different superscript letters are different (p < .05).
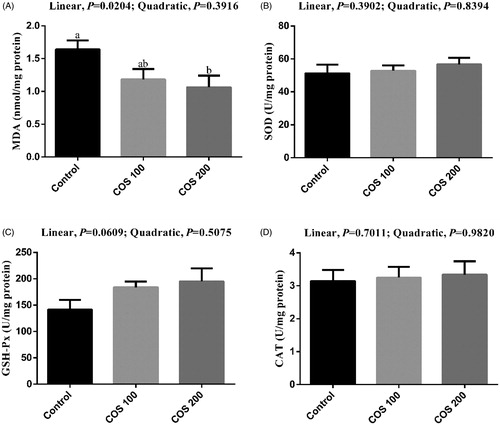
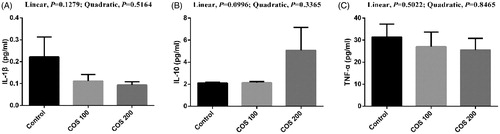
Figure 6. Effects of chitosan oligosaccharides (COS) on inflammatory cytokines in serum of yellow-feather broilers under high ambient temperature. Control group, basal diet; COS100 group, basal diet with 100 mg/kg COS; COS200 group, basal diet with 200 mg/kg COS. IL-1β: interleukin-1β; IL-10: interleukin-10; TNF-α: tumour necrosis factor-α. Values are mean ± standard error of mean. The values have different superscript letters are different (p < .05).
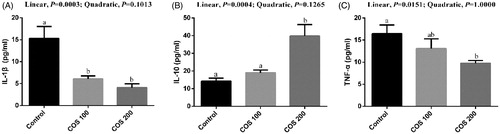
Figure 7. Effects of chitosan oligosaccharides (COS) on inflammatory cytokines in liver of yellow-feather broilers under high ambient temperature. Control group, basal diet; COS100 group, basal diet with 100 mg/kg COS; COS200 group, basal diet with 200 mg/kg COS. IL-1β: interleukin-1β; IL-10: interleukin-10; TNF-α: tumour necrosis factor-α. Values are mean ± standard error of mean.
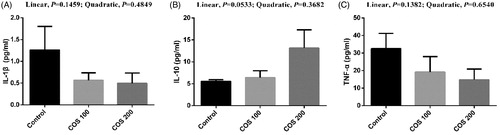
Figure 8. Effects of chitosan oligosaccharides (COS) on inflammatory cytokines in spleen of yellow-feather broilers under high ambient temperature. Control group, basal diet; COS100 group, basal diet with 100 mg/kg COS; COS200 group, basal diet with 200 mg/kg COS. IL-1β: interleukin-1β; IL-10: interleukin-10; TNF-α: tumour necrosis factor-α. Values are mean ± standard error of mean.