
Figures & data
Figure 1. Results of the analysis of 8 individual milk samples by the isoelectrofocusing (IEF) technique. The dots represent the IEF patterns corresponding to the B (black), C (grey) and G (white) variants.
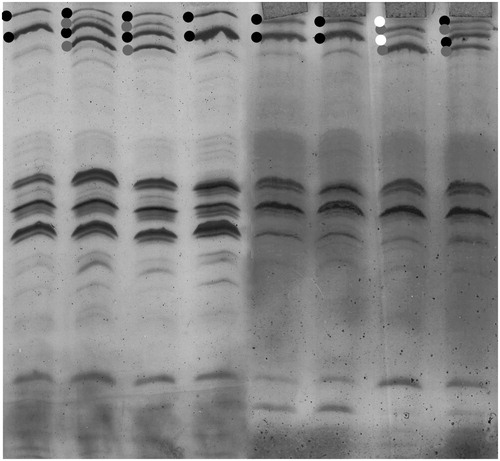
Table 1. Comparison between the allelic frequencies of the main milk protein in Piedmontese (PI), and Barà-Pustertaler (BP) breeds analysed within the present work and Italian Holstein (IH), Italian Brown (IB), and Reggiana (RE) breeds (Caroli et al. Citation2004; Chessa et al. Citation2020).
Table 2. Comparison between the casein haplotype frequencies in Piedmontese (PI), and Barà-Pustertaler (BP) breeds analysed within the present work and Italian Holstein (IH), Italian Brown (IB), and Reggiana (RE) breeds (Caroli et al. Citation2004; Chessa et al. Citation2020).