
Figures & data
Figure 1. SDS-PAGE of red kidney bean protein isolate (RPI) and Alcalase-red kidney bean hydrolysate (RBAH) generated by Alcalase after hydrolysis time (0, 15, 30 and 60 min), M: Tris glycine Marker.
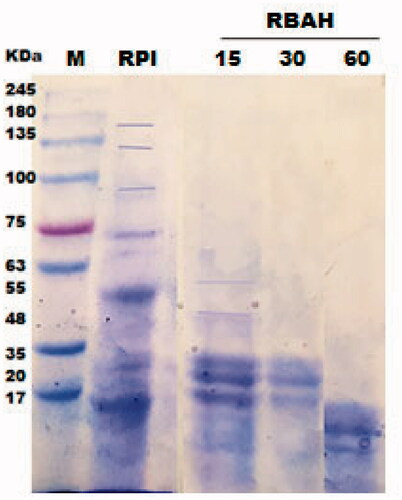
Figure 2. SDS-PAGE of protein isolate (PI) and 11S pea globulin (11SGP). (M: Tris glycine Marker; AS: acidic subunit; BS: basic subunit).
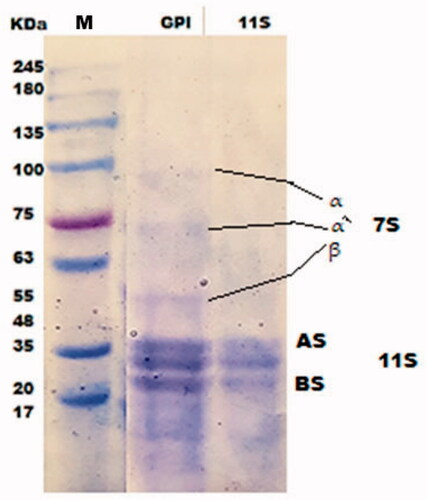
Figure 3. The pH-protein solubility curve of Alcalase-red kidney bean hydrolysate (RBAH) and 11S pea globulin (11SGP).
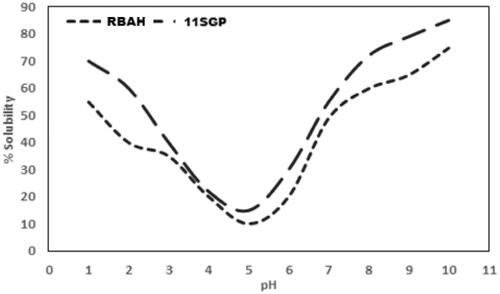
Figure 4. Development of red kidney bean protein isolate (RPI) hydrolysis with time at 37 °C and pH 6.
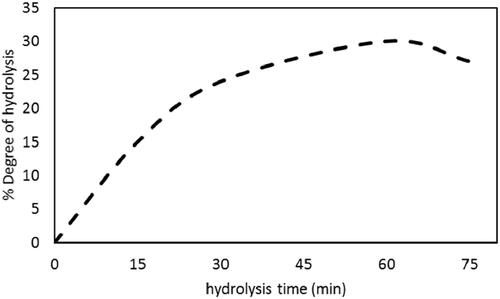
Figure 5. 2,2-diphenyl-1-picrylhydrazyl (DPPH) radical scavenging activity of Alcalase-red kidney bean hydrolysate (RBAH) and 11S pea globulin (11SGP) concentration as compared to tertiary butylhydroquinone (TBHQ). Data are presented means ± SE, different lowercase and uppercase letters indicate significant differences p ≤ .05.
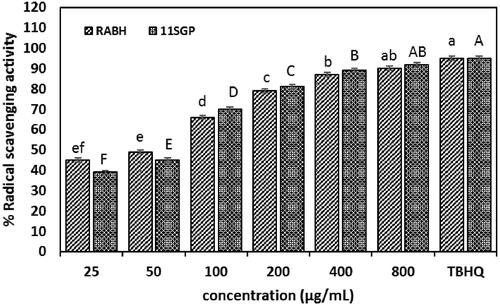
Figure 6. Diameter of inhibition zones (DIZ) in tested G + and G − bacteria, i.e. 1) Bacillus cereus; 2) Staphylococcus pyogenes; 3) Escherichia coli; 4) Acinetobacter baumannii affected by Alcalase-red kidney bean hydrolysate (RBAH) and 11S pea globulin (11SGP), A-F, Alcalase-red kidney bean hydrolysate (RBAH) and 11S pea globulin (11SGP) concentration (25, 50, 100, 200, 400 and 800 µg/mL).
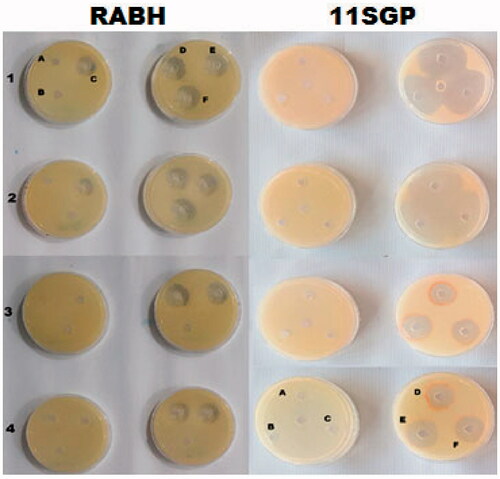
Table 1. Antimicrobial activity of red kidney bean alcalase hydrolysate (RABH) and 11S pea globulin (11SGP) (n = 5).
Figure 7. The effect of Alcalase-red kidney bean hydrolysate (RBAH) (B) and 11S pea globulin (11SGP) (A) with levels 800 µg/mL on Alternaria alternate growth.
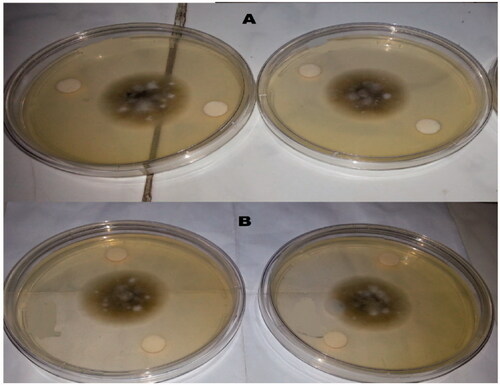
Figure 8. Growth curve of G + and G − bacteria in the presence of Alcalase-red kidney bean hydrolysate (RBAH) and 11S pea globulin (11SGP) peptides (60 µg/mL) concentration, different lowercase letters indicate significant differences p ≤ .05.
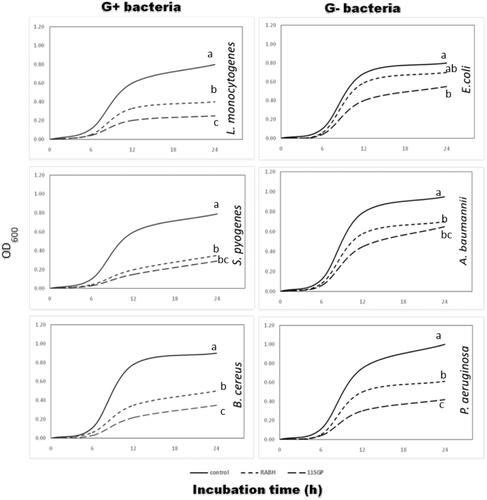
Table 2. Physicochemical changes during raw buffalo meat supplemented with red kidney bean alcalase hydrolysate (RABH and 11SGP) during cold preservation for 15 d (n = 5).
Table 3. Total bacterial count (TBC) and psychrophilic bacterial count (PBC) of raw buffalo meat during storage for 15 d at 4 °C (n = 5).
Table 4. The fluctuations in colour parameters during RBAH and 11SGP-supplemented meat during storage for 15 d at 4 °C. (n = 5).
Table 5. Sensory properties of RBAH and 11SGP-supplemented buffalo meat during the storage period (n = 5).