
Figures & data
Table 1. Experimental treatments.
Table 2. Diet ingredients and chemical analysis.
Table 3. Characteristics of the primers used in this study, and ileal and caecum microbial population analysis.
Table 4. List of the primers applied for ileum and caecum microbial population analysis.
Figure 1. Scanning electron micrographs of the microcapsules containing EO blend.
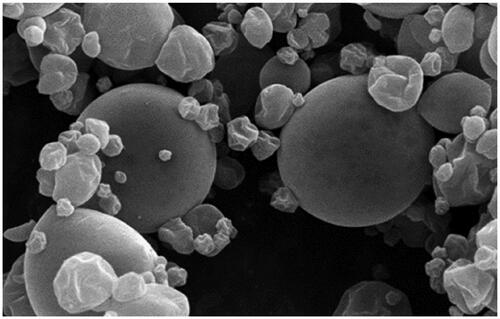
Table 5. Main phytochemical contents of the microcapsules.
Figure 2. In vitro percentage release of phenolic compounds in the microcapsule core in simulated gastric fluid and simulated intestinal fluid.
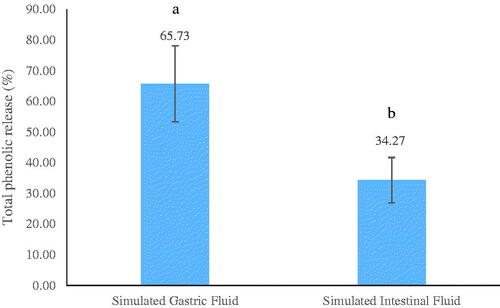
Table 6. Retention rates of phenolic compounds (%) in the digesta of the different GIT segments of 18-day-old broiler chickens after the oral gavage of unencapsulated and encapsulated EOs.
Table 7. Final weight, total feed intake, FCR, pH in the ileum and caecum of the differently-treated chickens.
Table 8. Antioxidant activity of serum and breast meat, and total phenolic content of the meat.
Table 9. Liver enzymes and immunoglobulins of serum, and total phenolics of breast meat.
Table 10. Gene expression analysis of ileum in the treated groups.
Table 11. Ileum and caecum microbial population analysis using real-time PCR among the treated groups.
Table 12. Ileum morphology and goblet cell count in the differently-treated chickens.