
Figures & data
Table 1. Ingredients and nutrients composition of basal dieta.
Table 2. Effect of dietary digestible threonine level on feed and nutrient intake of laying hens during the second cycle (105–116 wk of age)a.
Table 3. Effect of dietary digestible threonine level on productive performance of laying hens during the second cycle (105–116 wk of age)a.
Figure 1. Fitted plots of egg weight (Y, in g) vs. daily digestible threonine consumption (X, in mg/bird per day) of Hy-line-W36 laying hens fed from 100 to 112 weeks of age.
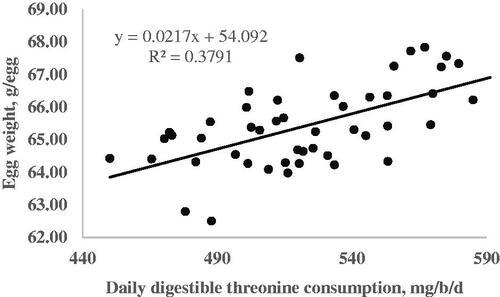
Figure 2. Fitted plots of hen-day egg production (Y, in %) vs. daily digestible threonine consumption (X, in mg/bird per day) of Hy-line-W36 laying hens fed from 100 to 112 weeks of age. Equations: Y = 78.41–0.0043(507-X)2 × I, I = 1 (if X < 507 or I = 0 (if X > 507), p <.0001, adj. R2 = 0.54. The break point occurred at 507 ± 8.8.
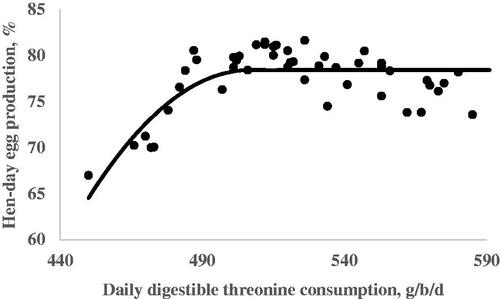
Figure 3. Fitted plots of egg mass (Y, in g/b/d) vs. daily digestible threonine consumption (X, in mg/bird per day) of Hy-line-W36 laying hens fed from 100 to 112 weeks of age. Equations: Y = 51.50 – 0.0022(514-X)2 × I, I = 1 (if X < 514 or I = 0 (if X > 514), p <.0001, adj. R2 = 0.59. The break point occurred at 514 ± 9.1.
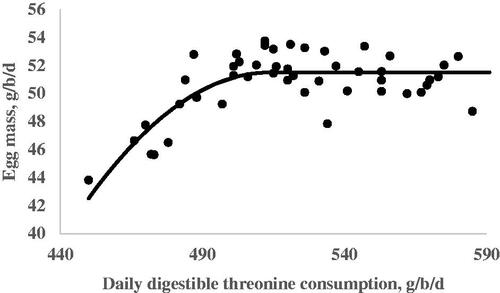
Figure 4. Fitted plots of feed conversion ratio (Y, in g feed intake/ g egg mass) vs. daily digestible threonine consumption (X, in mg/bird per day) of Hy-line-W36 laying hens fed from 100 to 112 weeks of age. Equations: Y = 2.08 + 0.000074(520 – X)2 × I, I = 1 (if X < 520 or I = 0 (if X > 520), p <.0001, adj. R2 = 0.45. The break point occurred at 520 ± 13.3.
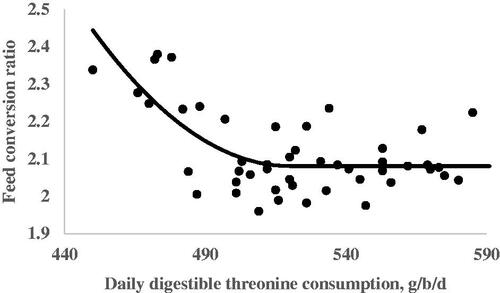
Table 4. Estimated digestible threonine requirements (mg/bird per day) for optimisation egg production parameters in laying hens during the second cycle (105–116 wk of age) by quadratic broken-line methodologya.
Table 5. Effect of dietary digestible threonine level on egg qualitative traits of laying hens during the second cycle (105–116 wk of age)a.
Table 6. Effect of dietary digestible threonine level on egg qualitative traits of of laying hens during the second cycle (105–116 wk of age)a.
Table 7. Effect of dietary digestible threonine level on blood metabolites of laying hens determined at the end of the experiment (116 wk of age)a.
Table 8. Effect of dietary digestible threonine levels on antibody titres responses to sheep red blood cell (SRBC) inoculation, cutaneous basophil hypersensitivity (CBH) responses elicited by phytohemagglutinin-P (PHA-M) intradermal injection, of laying hens determined 115–116 wk of agea.