
Figures & data
Table 1. Ingredient compositions and nutrient levels of basal diet for hens.a
Table 2. Primer used for quantitative real-time PCR.
Figure 1. Effects of dietary Cd contamination on Cd levels in egg white and magnum of laying hens. Data are presented as mean ± standard error of means (SEM). Different letters (a, b, c, d) indicate significant differences between groups (p < .05). Linear regression analysis was used to assess the dose-response relationship between Cd exposure and Cd contents in albumen and magnum.
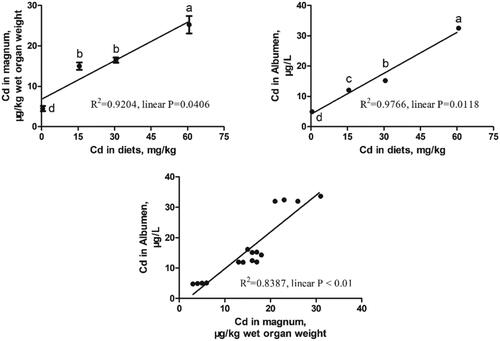
Figure 2. Effects of Cd on gene expressions in magnum (A) and protein levels in egg white (B, C) of laying hens. Data are presented as mean ± standard error of means (SEM) (n = 6). Different letters (a, b, c) above the histogram indicate significant differences between groups (p < .05). OV: ovomucin; OVA: ovalbumin; LYZ: lysozyme; OVM: ovomucoid; AVD: avidin.
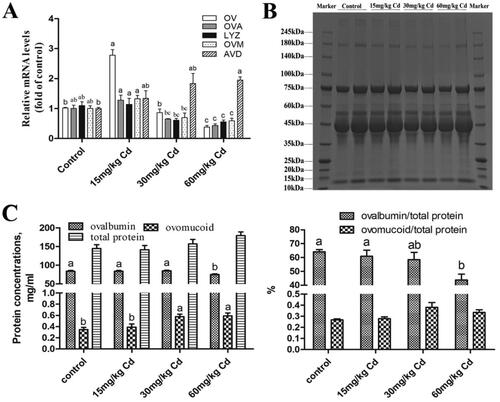
Figure 3. Effect of Cd on the antioxidant ability of the oviduct magnum (A) and egg white (B) of laying hens. Data are presented as mean ± standard error of means (SEM) (n = 6). Different letters (a, b, c) above the histogram indicate significant differences between groups (p < .05). GSH: glutathione; GSH-Px: glutathione peroxidase; T-SOD: total superoxide dismutase; CAT: catalase; MDA: malondialdehyde.
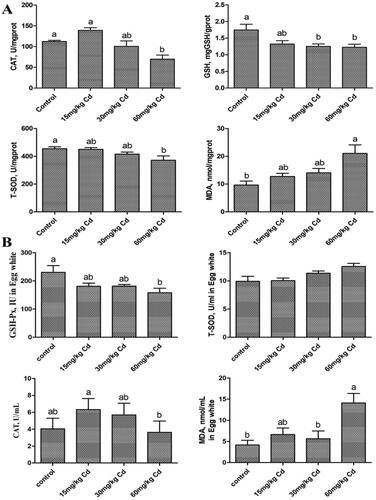
Table 3. Effect of Cd on the serum and yolk lipids in laying hens.
Figure 4. Effects of Cd on the Nrf2 signalling pathway in the oviduct magnum of laying hens. (A) Nrf2 pathway related gene expression; (B) Nrf2 and Keap1 protein expression levels. Data are presented as mean ± standard error of means (SEM) (n = 6). Different letters (a, b, c) above the histogram indicate significant differences between groups (p < .05). **p < .01 indicates a significant difference compared to the control group. Nrf2: nuclear factor-erythroid 2 p45-related factor 2; Keap1: kelch-like ECH-associated protein 1; NQO1: NAD(P)H quinone dehydrogenase 1; HO-1: haem oxygenase 1; GCLC: glutamate-cysteine ligase catalytic subunit; GCLM: glutamate-cysteine ligase modified subunit.
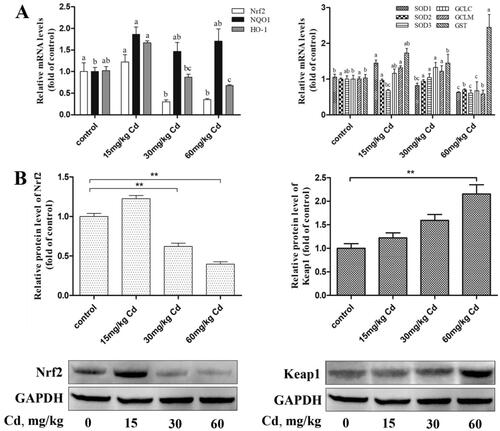
Figure 5. Effects of Cd on the expression of inflammatory factors in the oviduct magnum of laying hens. Data are presented as mean ± standard error of means (SEM) (n = 6). Different letters (a, b, c) above the histogram indicate significant differences between groups (p < .05). **p < .01 indicates a significant difference compared to the control group. IL: interleukin; TNFα: tumour necrosis factor α; NF-κB: nuclear factor kappa-B.
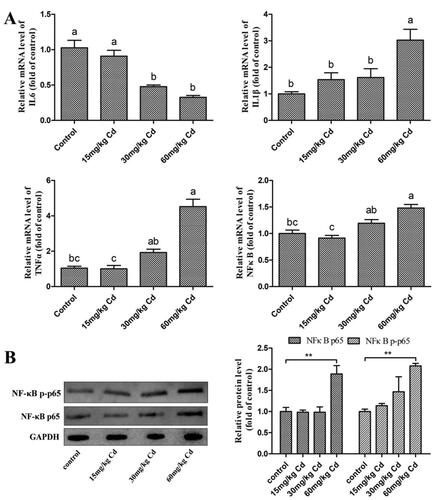
Figure 6. Effects of Cd on endoplasmic reticulum-stress in the oviduct magnum of laying hens. Data are presented as mean ± standard error of means (SEM) (n = 6). Different letters (a, b, c) above the histogram indicate significant differences between groups (p < .05). *p < .05 and **p < .01 indicates a significant difference compared to the control group.
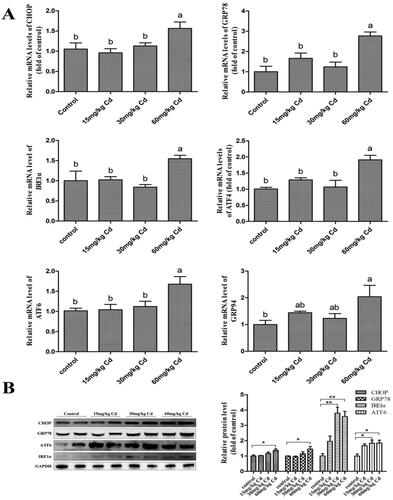
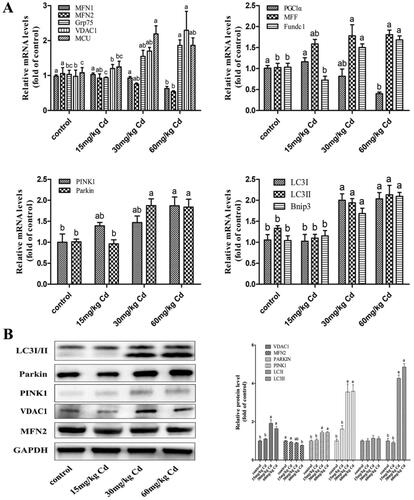
Figure 7. Effects of Cd on mitochondrial function and dynamics in the oviduct magnum of laying hens. Data are presented as mean ± standard error of means (SEM) (n = 6). Different letters (a, b, c) above the histogram indicate significant differences between groups (p < .05).
Data availability statement
The data that support the findings of this study are available from the corresponding author, upon reasonable request.