
Figures & data
Table 1. Growth and immune indices of Chinese chickens fed basal diet (control) and the diet added fermented compound Chinese herbs (treatment).
Figure 1. Effects of fermented compound Chinese herbal medicine on caecum microbiota compositions of Chinese chickens. (A) Venn diagram shows the difference in species number between treatment and control groups; (B) Rarefaction curve; (C) Goods’ coverage; (D) Feature number; (E) ACE index; (F) Shannon index; (G) Simpson index; (H) PCoA; (I) compositions of dominant phyla in the caecum microbiota; and (J) compositions of main genera in the caecum microbiota.
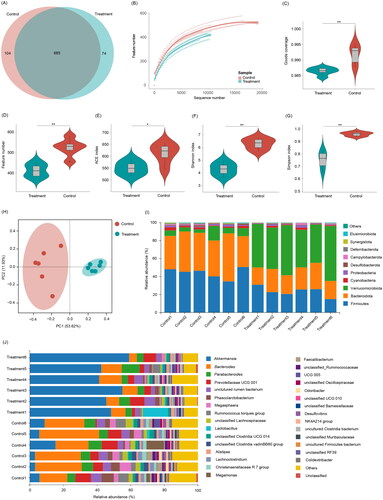
Figure 2. Differences in dominant genera in caecal microbiota between the treatment and control groups of Chinese chickens. (A) Heatmap; (B) Extended error bar; (C) LEfSe. *p < 0.05; **p < 0.01; ***p < 0.001.
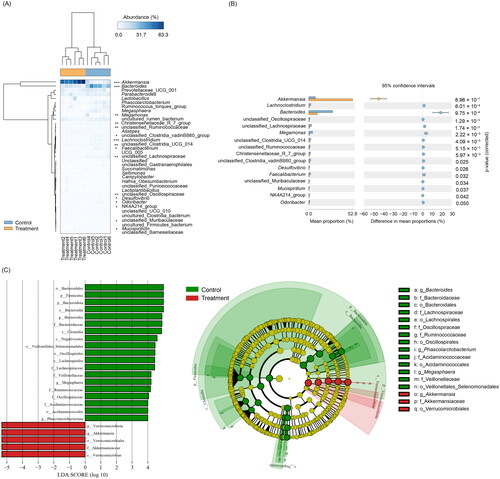
Figure 3. OPLS-DA model (a), volcano plot (B), bubble chart (C) and heatmap (D) showing the significantly different metabolites in the Chinese chicken caecum induced by fermented compound Chinese herbal medicine. Each point in the volcano plot represents a metabolite. The x-axis represents the multiple changes of the metabolites, and the y-axis represents the P-value of the test (logarithm with the base of 10). the sizes of the scatter points represent the VIP values of the OPLS-DA model. The data had been standardised before the heatmap drawing.
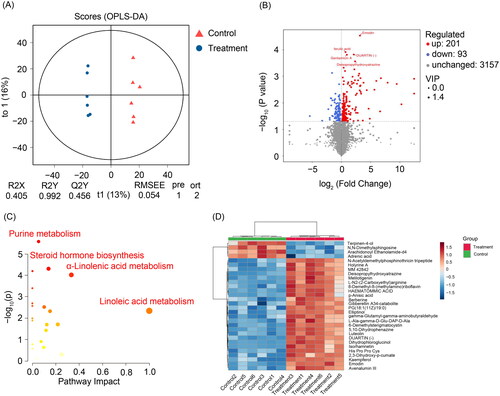
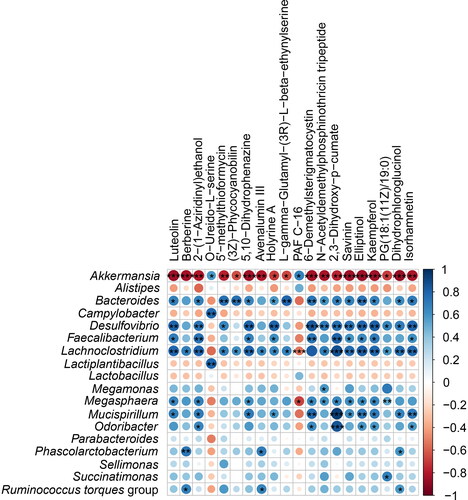
Figure 4. The bubble chart showing the correlations between caecal microorganisms and metabolites. Results with Pearson correlation coefficient > 0.6and p < 0.05 were considered significant. *p < 0.06; **p < 0.01; ***p < 0.001.
Data availability statement
The sequences were delivered to the NCBI SRA database with accession number PRJNA906741.