Figures & data
Table 1. Dataset (descriptive statistics).
Figure 1. Lorenz posting curve and perfect posting equality line for Rapture forum.
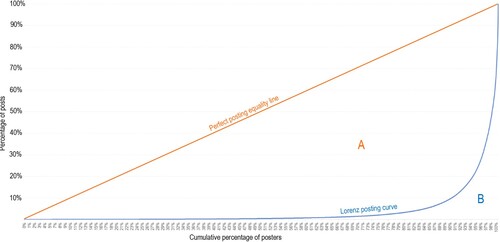
Figure 2. Network representation of the two opposing ideal-types of extremist forums, in their most extreme forms: vertical indoctrination space with pure minority influence (left) and horizontal echo-chamber with pure majority influence (right).
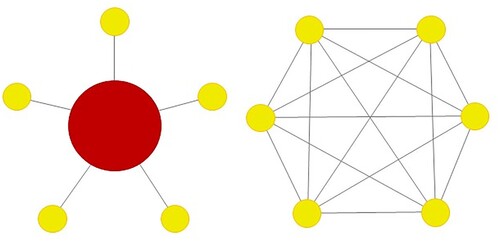
Table 2. Gini coefficients for extremist and control forums.
Figure 3. Posting inequality (Gini coefficients) by median number of posts per day in extremist forums.
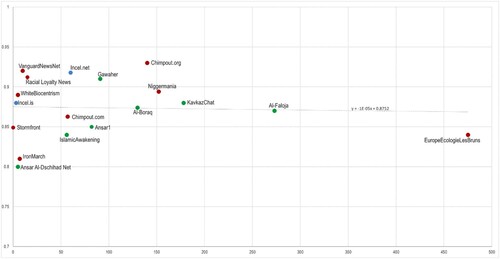
Figure 4. Distribution of posting inequality in extremist and non-extremist forums.
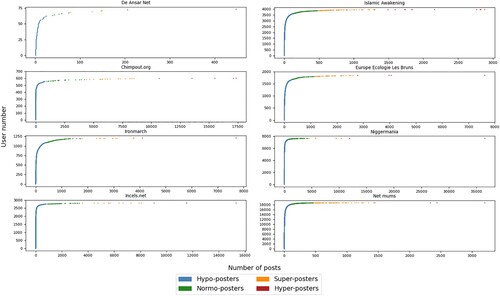
Figure 5. Network and top-10 degree and betweenness centrality rankings for the forum with the lowest inequality and low activity: Ansar al-Dschihad Netzwerk.
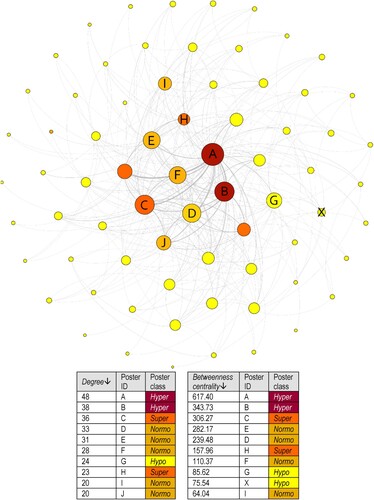
Figure 6. Network and top-10 degree and betweenness centrality rankings for the forum with the highest inequality and average activity: Chimpout.org.
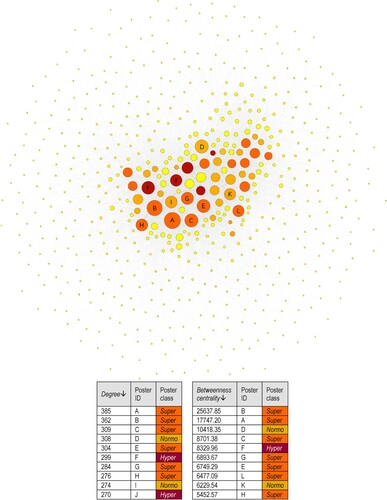
Figure 7. Network and top-10 degree and betweenness centrality rankings for the most active forum with average inequality: EuropeEcologieLesBruns
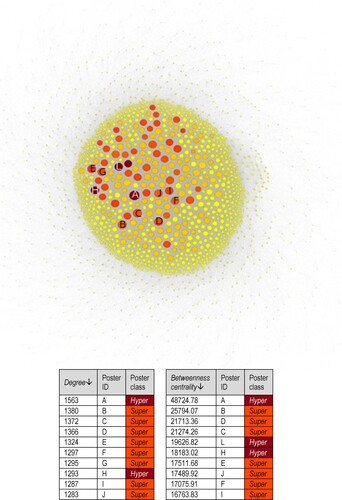
Figure A1: The goodness of fit in variance graph for Chimpout.com. It can be seen from the "elbow" in the data that 4 groups was the optimal number for this forum.
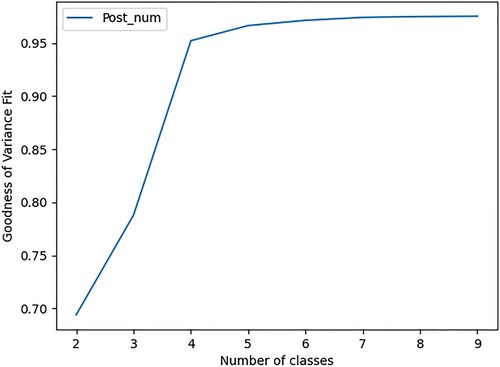
Figure A2: The goodness of fit in variance graph for Chimpout.org. It can be seen from the “elbow” in the data that 4 groups was the optimal number for this forum.
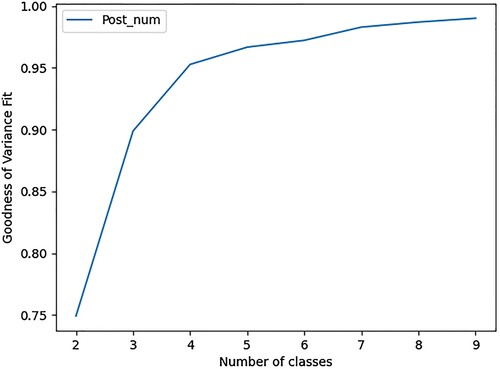
Figure A3: The goodness of fit in variance graph for Islamic Awakening. It can be seen from the "elbow" in the data that 4 groups was the optimal number for this forum.
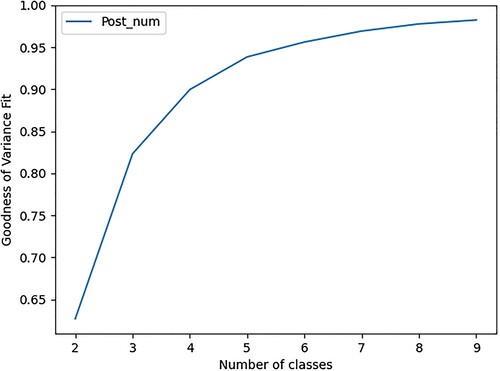
Figure A4: The goodness of fit in variance graph for Gawaher. It can be seen from the "elbow" in the data that 4 groups was the optimal number for this forum.
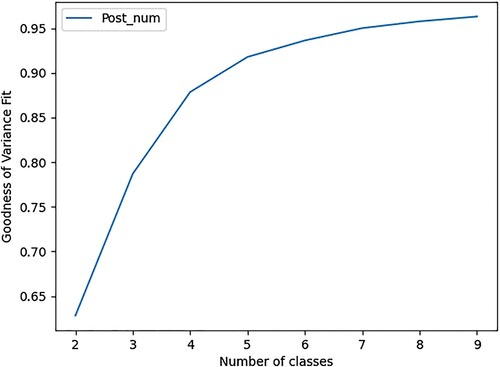
Figure A5: The goodness of fit in variance graph for Incels.is. It can be seen from the "elbow" in the data that 4 groups was the optimal number for this forum.
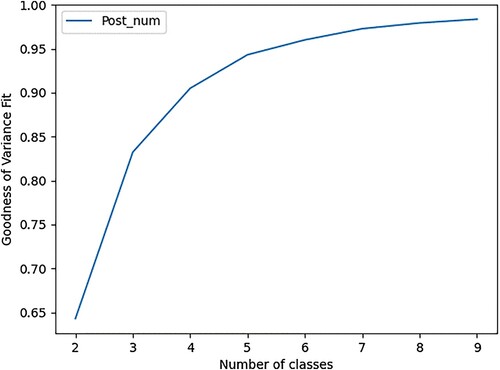
Figure A6: Posting distribution and classes of posters for Far-right extremist forums.
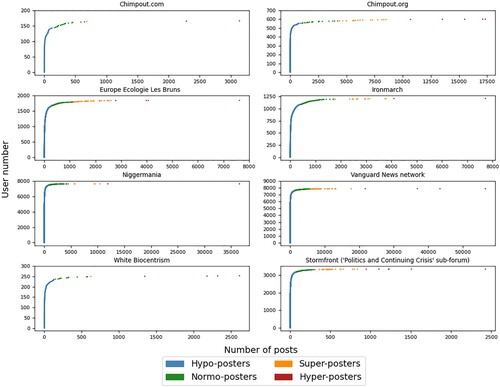
Figure A7: Posting distribution and classes of posters for Salafi-jihadist extremist forums.
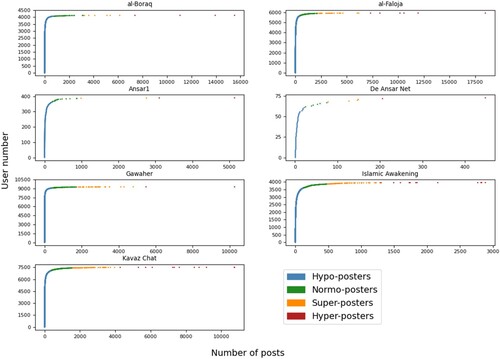
Figure A8: Posting distribution and classes of posters for Incel extremist forums.
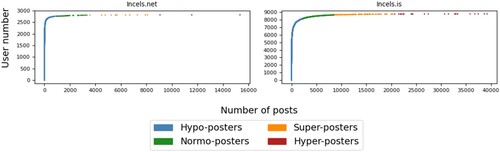
Figure A9: Posting distribution and classes of posters for control forums.
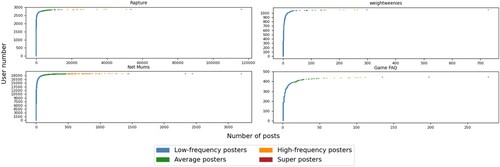
Table A1. User network matrix for hypothetical forum.
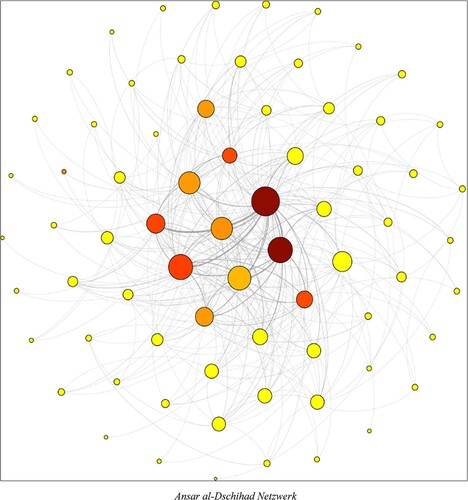
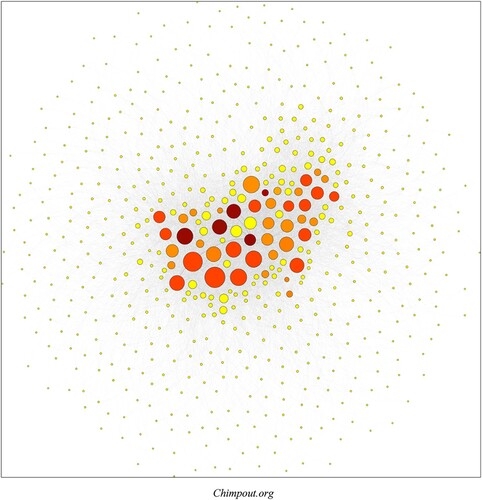
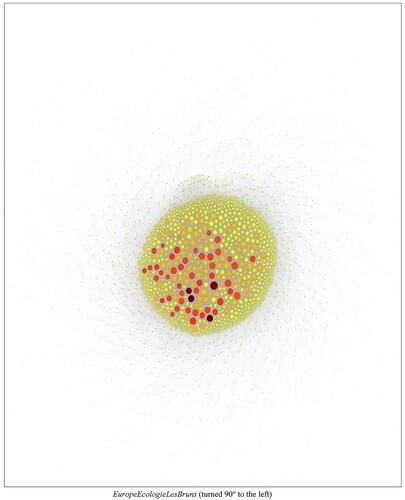
Figure A1. The number of posts made to Chimpout.com by the three top posters in the forum per day (red, green, and blue lines) and the average number of posts made per day by all other users (grey line).
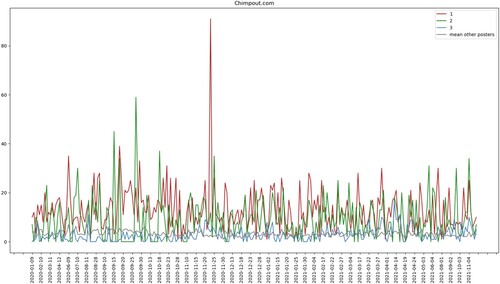
Figure A2. The number of posts made to Chimpout.org by the three top posters in the forum per day (red, green, and blue lines) and the average number of posts made per day by all other users (grey line).
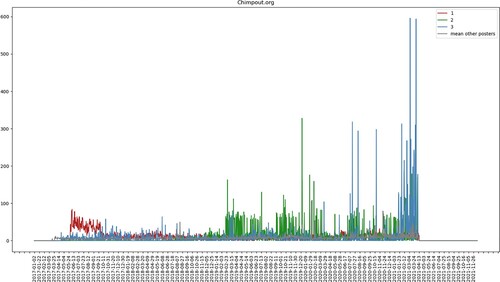
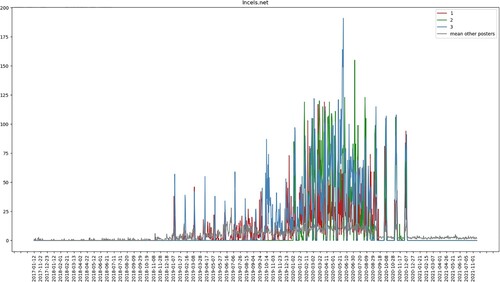
Figure A3. The number of posts made to Incels.net by the three top posters in the forum per day (red, green, and blue lines) and the average number of posts made per day by all other users (grey line).