
Figures & data
Figure 1. Schematic diagram of deposition equipment.
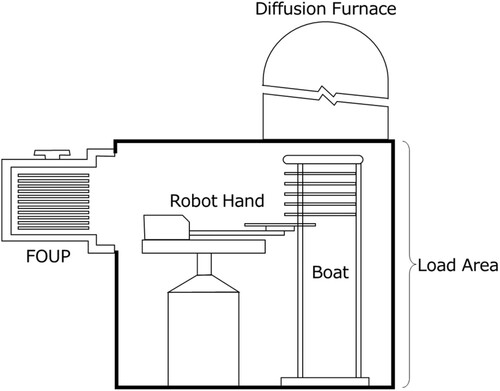
Figure 2. Scatter plots of oxygen concentration and pressure in the monitoring section: (a) normal equipment and (b) anomalous equipment.
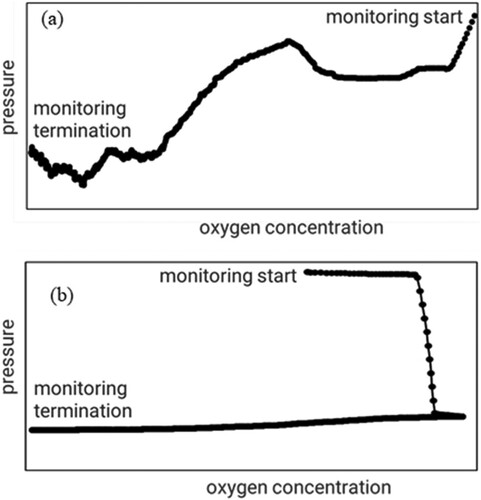
Figure 3. Oxygen concentration change during N2 purge.
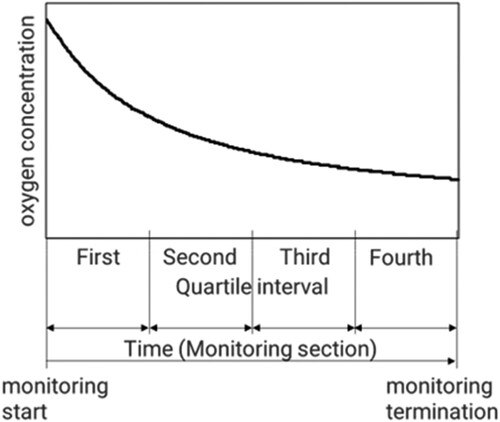
Table 1. Measurements and preprocessing used for feature extraction.
Figure 4. Image of displacement from the first quartile interval to the fourth quartile interval.
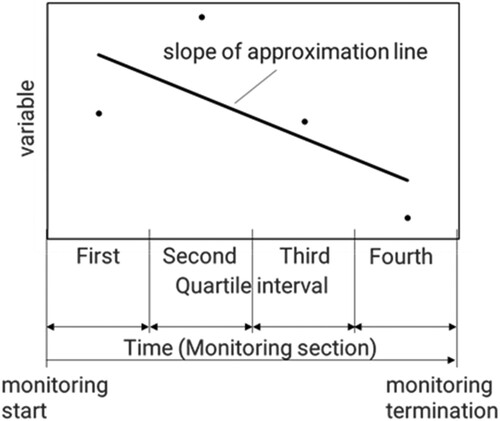
Table 2. Two-dimensional distribution table of OX and PR10MA,d.
Table 3. Features calculated from data acquired from the equipment.
Table 4. Comparison of AUC for univariate detection models.
Table 5. Comparison of detection ability of models made with two features.
Table 6. Comparison of detection ability of models made with three features.
Table 7. Comparison of detection ability of models made with four features.
Table 8. Anomaly detection result by a single variable model (using F06).
Table 9. Anomaly detection result by two variables model (using F06, F16).
Table 10. Anomaly detection result by three variables model (using F06, F10, F11).