
Figures & data
Table 1. LBS Factors identified by Fitzsimmons-Doolan (Citation2014).
Table 2. Correlation between LATS and LBS.
Figure 1. Decision tree model of how demographic characteristics related to LATS scores. Note: Darker shading = higher score; solid border = highest score; dashed outline = lowest score). Scores shown are the average total LATS score for each subgroup, with higher scores indicating relatively more positive attitudes toward linguistic diversity/language support than lower scores (Byrnes & Kiger, Citation1994).
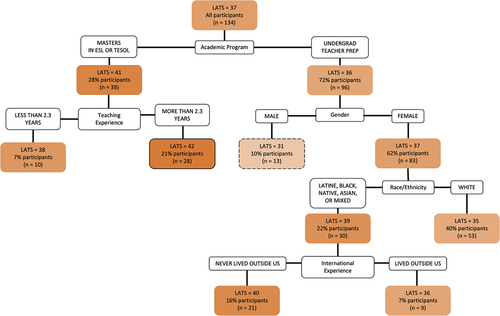
Figure 2. Decision tree model of how demographics related to LBS Pro-Multilingualism scores (Note: Darker shading = higher score; solid border = highest score; dashed outline = lowest score). Participants responded to the 6-point Likert-scale questions (5 = strongly agree, 4 = agree, 3 = somewhat agree, 2 = somewhat disagree, 1 = disagree, 0 = strongly disagree). A score of 4.7 shows that the subgroup averages a score between agree strongly agree.
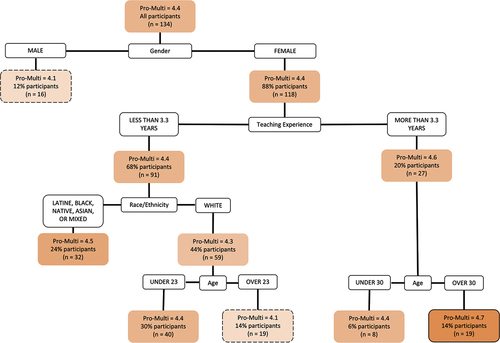
Figure 3. Decision tree model of how demographic characteristics relate to LBS Pro-Monolingualism scores (note that shading and borders are reversed here, so that darker still indicates a more positive stance toward linguistic diversity). Participants responded to the 6-point Likert-scale questions (5 = strongly agree, 4 = agree, 3 = somewhat agree, 2 = somewhat disagree, 1 = disagree, and 0 = strongly disagree). A score of 2.2 shows that the subgroup averages a score between somewhat disagree and somewhat agree.
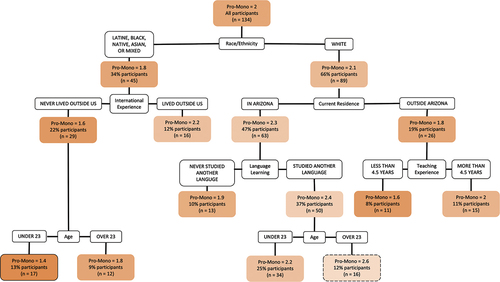
Figure 4. Decision tree model of how demographic characteristics relate to DLBE support. Note: Darker shading = higher score; solid border = highest score; dashed outline = lowest score. Participants responded to the 6-point Likert-scale questions (5 = strongly agree, 4 = agree, 3 = somewhat agree, 2 = somewhat disagree, 1 = disagree, and 0 = strongly disagree). A score of 3.6 shows that the subgroup averages a score between somewhat agree and agree.
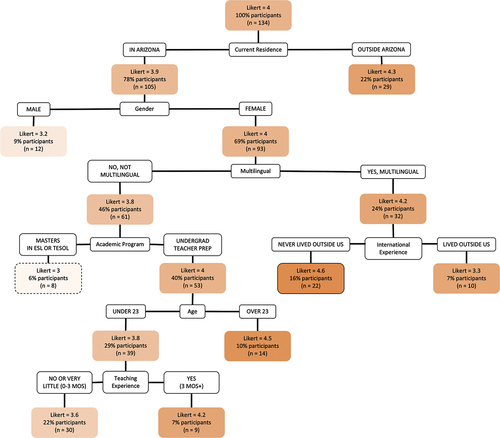
Table 3. Demographic variables that lead to increased scores on language ideologies measures (RQ 1a) and support for DLBE (RQ 1b).
Figure 5. Decision tree model of how reasons relate to DLBE support. Note: Darker shading = higher score; solid border = highest score; dashed outline = lowest score. Participants responded to the 6-point Likert-scale questions with higher number indicating more DBLE support (5 = strongly agree, 4 = agree, 3 = somewhat agree, 2 = somewhat disagree, 1 = disagree, and 0 = strongly disagree).
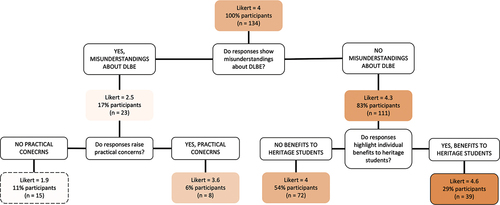
Figure 6. Decision tree model of how reasons relate to LATS scores. Note: Darker shading = higher score; solid border = highest score; dashed outline = lowest score. Scores shown are the average total score on the LATS for each subgroup with higher scores indicating relatively more positive attitudes toward linguistic diversity than lower scores (Byrnes & Kiger, Citation1994).
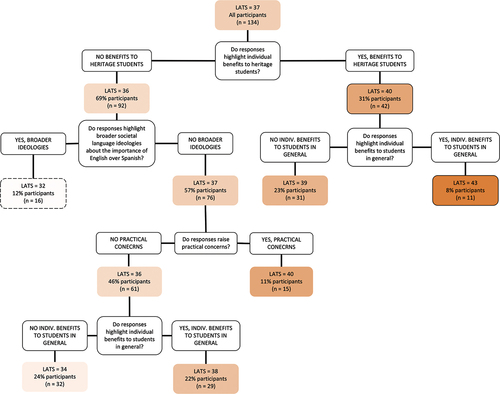
Figure 7. Decision tree model of how reasons relate to LBS Pro-Multilingualism scores. Note: Darker shading = higher score; solid border = highest score; dashed outline = lowest score. Participants responded to the 6-point Likert-scale questions (5 = strongly agree, 4 = agree, 3 = somewhat agree, 2 = somewhat disagree, 1 = disagree, and 0 = strongly disagree). Each subgroup in this model averages a score between agree and strongly agree.
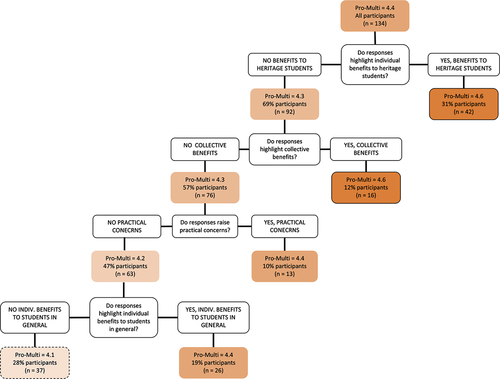
Figure 8. Decision tree model of how reasons relate to LBS Pro-Monolingualism scores.
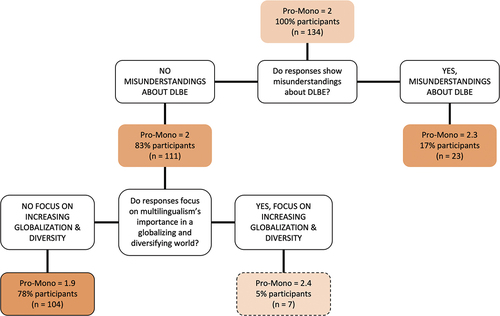
Table 4. Reason shaping support for DLBE implementation and language ideologies.