Figures & data
Figure 1. Effect of Cln3-deficiency on Dictyostelium aggregation and mound formation. (A) Cells imaged after 3, 4.5, 6, and 9 hours of development. M, mound. R, Ripple. Scale bar = 1 mm. (B) Quantification of the number of mounds observed after 9 hours of development. Data presented as the mean number of mounds ± SEM (n > 10). *p-value < 0.05 vs. WT [one-way ANOVA (*p < 0.05) followed by the Bonferroni multiple comparison test].
![Figure 1. Effect of Cln3-deficiency on Dictyostelium aggregation and mound formation. (A) Cells imaged after 3, 4.5, 6, and 9 hours of development. M, mound. R, Ripple. Scale bar = 1 mm. (B) Quantification of the number of mounds observed after 9 hours of development. Data presented as the mean number of mounds ± SEM (n > 10). *p-value < 0.05 vs. WT [one-way ANOVA (*p < 0.05) followed by the Bonferroni multiple comparison test].](/cms/asset/8ffe5540-1ae4-4995-94e0-9d2528ae46dc/kcam_a_1236179_f0001_oc.gif)
Figure 2. Localization of GFP-Cln3 in Dictyostelium cells during growth and starvation. Growth-phase cells and cells starved for 3 and 6 hours in KK2 buffer were fixed either in ultra-cold methanol (for VatC and Rh50 immunostaining) or 4% paraformaldehyde (for p80 immunostaining) and then probed with anti-VatC, anti-Rh50, and anti-p80, followed by secondary antibodies linked to Alexa 555 (red). Cells were stained with DAPI to reveal nuclei (blue). Images were merged with ImageJ. P, punctate. T, tubules. VC, vacuoles. VS, vesicles. Scale bars = 5 µm.
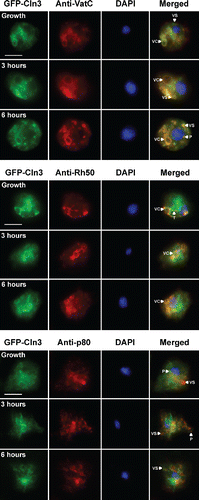
Figure 3. (see previous page) Effect of Cln3-deficiency on cAMP chemotaxis. (A) Cells plated on 0.5% agar/KK2 + cAMP (10 μM). Pictures of cell spots were taken at 0 and 4 hours. Scale bar = 200 µm. (B) Quantification of the total distance migrated by cells after 4 hours. Data presented as the mean total distance migrated ± SEM (n=14). **p-value < 0.01 (2-sample t-test). (C) Cells plated on 0.5% agar/KK2. Pictures of cell spots were taken at 0 and 4 hours. Scale bar = 100 µm. (D) Quantification of the cell spot area that remained after 4 hours of starvation. Data presented as the mean area of cell spot remaining after 4 hours ± SEM (n = 14). *p-value < 0.05 (2-sample t-test). (E) The panels show the centroid tracks of 14 WT cells (left) and 12 cln3− cells (right) migrating in KK2 buffer toward natural aggregation territories (i.e., mounds, denoted M). Scale bar = 50 µm. (F) Quantitation of motility parameters. Speed and chemotactic index (CI) were measured as described in the Materials and Methods. Data presented as mean ± SD (n = 3). Statistical significance was assessed using the 2-sample t-test. The p-values obtained were 0.361 and 0.063 for CI and cell speed, respectively.
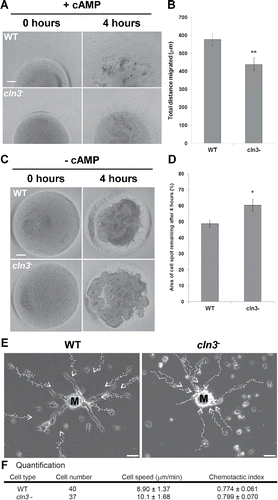
Figure 4. (see previous page) Effect of Cln3-deficiency on streaming and aggregation during Dictyostelium starvation. (A) Effect of Cln3-deficiency on the onset of cell de-adhesion from the substrate. Data presented as the mean onset of de-adhesion ± SEM (n = 9). (B) Effect of Cln3-deficiency on the onset of cAMP pulsing. Data presented as the mean onset of cAMP pulsing ± SEM (n = 9). (C) Effect of Cln3-deficiency on the onset of cell migration toward the aggregation center. Data presented as the mean onset of migration toward aggregation center ± SEM (n = 9–10). (D) Effect of Cln3-deficency on the periodicity of cAMP waves. Data presented as the mean periodicity of cAMP waves ± SEM (n = 9–10). (E) Screenshots obtained from time-lapse movies capturing the early development of WT and cln3− cells, and the effect of EGTA (0.1 mM and 0.25 mM) on cln3− streaming and aggregation. Scale bar = 250 µm. (F) Effect of Cln3-deficiency on the number of aggregation centers after 6–7 hours of starvation. Representative images from 3 independent experiments are shown. Scale bar = 0.25 cm. (G) Effect of Cln3-deficiency on the morphology of streaming cells. Two representative images are shown for each cell line. Scale bar = 250 µm. (H) Effect of manual cAMP pulsing on cln3− early development. Cells were pulsed with cAMP for 6 hours, after which time an aliquot of cells was vigorously vortexed and placed on a glass slide. Cells were then imaged 30 minutes post-plating (6.5 hours total starvation). Images are representative of results from 3 independent experiments. Scale bar = 100 µm (inset, 20 µm). *p-value < 0.05 (2-sample t-test).
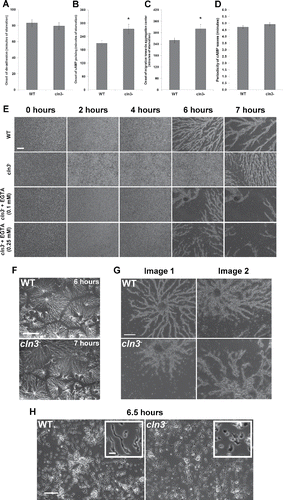
Figure 5. Effect of Cln3-deficiency on the expression of genes linked to cAMP signal transduction and the localization of CarA. (A) qPCR of genes linked to cAMP signal transduction. Data presented as the mean normalized gene expression ± SEM (n=4). (B) Whole cell lysates (5 µg) from cells starved for 3 and 6 hours were separated by SDS-PAGE and analyzed by western blotting with anti-CarA and anti-β-actin (loading control). Molecular weight markers (in kDa) are shown to the right of each blot. (C) CarA protein bands were quantified and plotted. Data presented as the mean normalized band intensity ± SEM (n=4). (D) Effect of Cln3-deficiency on the localization of CarA in WT and cln3− cells after 6 hours of starvation. Cells were incubated with anti-CarA followed by secondary antibodies linked to Alexa Fluor 488 (green). Two representative cells are shown for each strain. Scale bar = 5 µm.
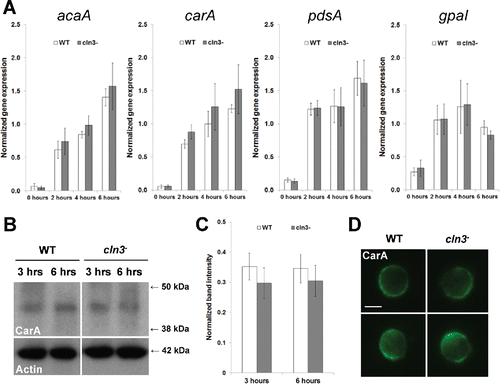
Figure 6. Effect of Cln3-deficiency on cell-substrate adhesion during Dictyostelium starvation. (A) Cells were deposited in 6-well dishes and allowed to adhere to the bottom of the dish for 2 hours. Cells were washed 2 times with KK2 buffer and then starved in KK2 buffer for 3 and 6 hours. Scale bars = 100 µm. (B) Cell-substrate adhesion after 3 and 6 hours of starvation. Data presented as the mean percent total protein compared to the 0 hour sample ± SEM (n = 6). **p-value < 0.01; ***p-value < 0.001 [one-way ANOVA (***p = 0.001) followed by the Newman-Keuls multiple comparison test].
![Figure 6. Effect of Cln3-deficiency on cell-substrate adhesion during Dictyostelium starvation. (A) Cells were deposited in 6-well dishes and allowed to adhere to the bottom of the dish for 2 hours. Cells were washed 2 times with KK2 buffer and then starved in KK2 buffer for 3 and 6 hours. Scale bars = 100 µm. (B) Cell-substrate adhesion after 3 and 6 hours of starvation. Data presented as the mean percent total protein compared to the 0 hour sample ± SEM (n = 6). **p-value < 0.01; ***p-value < 0.001 [one-way ANOVA (***p = 0.001) followed by the Newman-Keuls multiple comparison test].](/cms/asset/1ffa732c-a4cd-42de-8299-a26066fd7377/kcam_a_1236179_f0006_b.gif)
Figure 7. Effect of Cln3-deficiency on cell-cell adhesion during Dictyostelium starvation. (A-D) Cells starved for 0, 2, 4, and 6 hours were added to separate wells of a 12-well dish containing KK2 buffer ± EDTA (20 mM). Dishes were spun at 150 rpm for 30 minutes at room temperature. Cells were fixed with glutaraldehyde and then placed in a hemocytometer for analysis. Scale bar = 250 µm. Data presented as the mean percent single cells ± SEM (n=4). Control: Concentration of the cell suspension at 0 hours. *p-value < 0.05; **p-value < 0.01; ***p-value < 0.001 [one-way ANOVA (****p < 0.0001) followed by the Newman-Keuls multiple comparison test]. (E) Effect of manual cAMP pulsing on the adhesion of cln3− cells. Cells were pulsed with cAMP for 6 hours and imaged. Images are representative of results from 3 independent experiments. Scale bar = 100 µm.
![Figure 7. Effect of Cln3-deficiency on cell-cell adhesion during Dictyostelium starvation. (A-D) Cells starved for 0, 2, 4, and 6 hours were added to separate wells of a 12-well dish containing KK2 buffer ± EDTA (20 mM). Dishes were spun at 150 rpm for 30 minutes at room temperature. Cells were fixed with glutaraldehyde and then placed in a hemocytometer for analysis. Scale bar = 250 µm. Data presented as the mean percent single cells ± SEM (n=4). Control: Concentration of the cell suspension at 0 hours. *p-value < 0.05; **p-value < 0.01; ***p-value < 0.001 [one-way ANOVA (****p < 0.0001) followed by the Newman-Keuls multiple comparison test]. (E) Effect of manual cAMP pulsing on the adhesion of cln3− cells. Cells were pulsed with cAMP for 6 hours and imaged. Images are representative of results from 3 independent experiments. Scale bar = 100 µm.](/cms/asset/2bce3e3b-324a-4553-962d-9e344d9f63ba/kcam_a_1236179_f0007_b.gif)
Figure 8. (see previous page) Effect of Cln3-deficiency on the expression and localization of CsaA during Dictyostelium starvation. (A) Whole cell lysates (5 µg) from growth-phase cells and cells starved for 6 hours in KK2 buffer were separated by SDS-PAGE and analyzed by western blotting with anti-CsaA and anti-β-actin (loading control). Molecular weight markers (in kDa) are shown to the left of each blot. (B) CsaA protein bands were quantified and plotted. Western blot (WB) data presented as the mean normalized band intensity ± SEM (n = 4). (C) Effect of Cln3-deficiency on the expression of csaA. qPCR data presented as the mean normalized gene expression ± SEM (n = 4). (D) Effect of Cln3-deficiency on the localization of CsaA in cells starved for 6 hours. Cells were incubated with anti-CsaA followed by secondary antibodies linked to Alexa Fluor 488 (green). Images are representative of 3 independent experiments. Scale bar = 25 µm. (E) Effect of tunicamycin on WT and cln3− cells during starvation. Cells were imaged after 6 hours of starvation. Scale bar = 200 µm. (F) Whole cell lysates (5 µg) from cells starved for 6 hours in KK2 buffer ± tunicamycin were separated by SDS-PAGE and analyzed by western blotting with anti-CsaA and anti-β-actin (loading control). Immunoblots that were exposed for a longer period of time are included to show the immature forms of CsaA (indicated by arrows to the right of the blot). Molecular weight markers (in kDa) are shown to the left of each blot. DMSO (D, control), Tunicamycin (T, 0.4 µg/ml). (G) The amount of fully glycosylated CsaA in each sample was quantified and plotted. Data presented as the mean normalized band intensity ± SEM (n = 3). (H) The amount of immature CsaA (70 kDa and 50 kDa) present in samples treated with tunicamycin was quantified and plotted. Data presented as the mean normalized band intensity ± SEM (n = 3). *p-value < 0.05 (2-sample t-test).
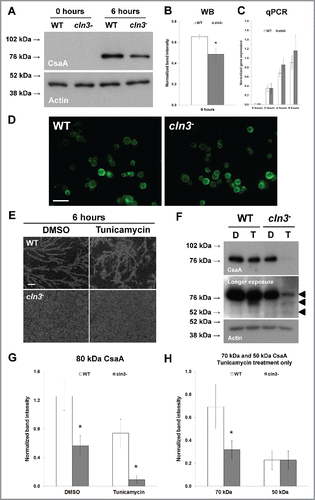
Figure 9. Effect of Cln3-deficiency on the intra- and extracellular levels of CadA during Dictyostelium starvation. (A) Whole cell lysates (WC, 5 µg) from cells starved for 0 and 6 hours in KK2 buffer were separated by SDS-PAGE and analyzed by western blotting with anti-CadA and anti-β-actin (loading control). Molecular weight markers (in kDa) are shown to the left of each blot. (B) CadA protein bands were quantified and plotted. Western blot (WB) data presented as the mean amount of protein relative to WT 0 hour sample ± SEM (n = 8). (C) Effect of Cln3-deficiency on the expression of cadA. qPCR data presented as the mean normalized gene expression ± SEM (n = 4). (D) Equal volumes of conditioned media (CM) from 6 hour starved cells (24 µl) were separated by SDS-PAGE and analyzed by western blotting with anti-CadA, anti-β-actin (fractionation control), and anti-tubulin (fractionation control). Molecular weight markers (in kDa) are shown to the left of each blot. (E) CadA protein bands were quantified and plotted. Data presented as the mean amount of protein relative to WT sample ± SEM (n = 8). **p-value < 0.01 (one-sample t-test).
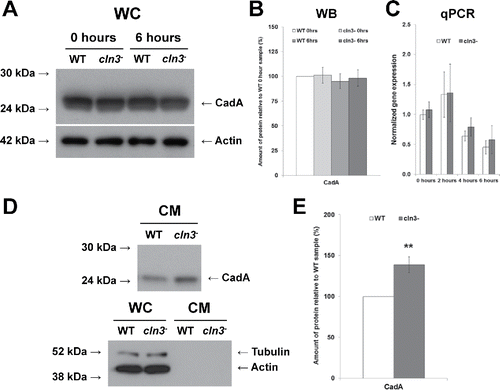
Table 1. Primers used for qPCR.
