Figures & data
Figure 2. cpnC− mutants made large ring structures and small fruiting bodies during multicellular development. Parental and cpnC− cells were allowed to development on agar plates. Cells were imaged every 10 minutes for 24 hours on a dissecting microscope. Representative images of specific developmental stages are shown with hours after plating (5,9,13,19, and 23 hrs) as indicated. Black arrows point to rings during mound stage at 9 hrs. White arrow points to multiple slugs formed from a single ring of cpnC− cells at 13 hrs. Mature fruiting body images were captured with the addition of a darkfield adaptor at 48 hours post starvation. Scale bar = 500 µm. See accompanying time-lapse movies (S1 and S2).
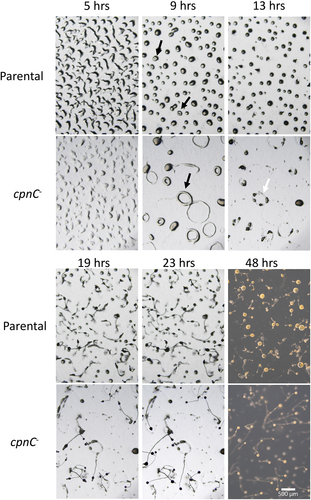
Figure 1. cpnC− cells had normal growth rates and increased multinucleation. A) Parental and cpnC− cells were grown in suspension starting at a density of 5 × 10⁴ cells/mL. Density estimates were made using a hemocytometer once a day for 7 days. Mean cell densities were calculated from six trials and a repeated measures ANOVA and post hoc Tukey comparisons was used to analyze significant differences between parental and cpnC− cells. B) parental and cpnC− cells were grown in suspension for 48 hours, fixed, stained with DAPI, and imaged with fluorescence microscopy. The number of nuclei present in > 300 randomly selected cells were counted in each trial and the mean number of nuclei per cell was calculated. The mean number of nuclei from five trials were averaged and a t-test was used to analyze significant differences between parental and cpnC− cells. *indicates p-value <0.05, error bars=standard error. C) Representative images of DAPI stained cells, scale bar = 5 µm.
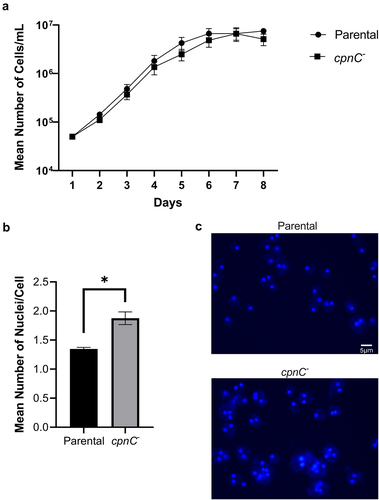
Figure 3. cpnC− cells exhibited decreased adhesion to beads and no phagocytosis defect. A) Parental (circles) and cpnC− (squares) cells were incubated with 1 µm FITC-labeled beads. Cell samples were collected at different timepoints, washed in Sorensen’s buffer with (open symbols) or without (closed symbols) sodium azide (SA), fixed, and analyzed using flow cytometry. Data from 3 trials for cell samples without sodium azide and data from 4 trials with sodium azide (n = 10,000 cells per sample) were analyzed for significant differences using a repeated measures ANOVA and post hoc Tukey comparisons. *indicates a significant difference between parental and cpnC− cells at all non-zero timepoints, p < 0.05. Error bars=standard error. B) parental and cpnC− cells were plated with E. coli on agar. Plaques were imaged after three days with a dissecting microscope. Individual plaque areas were measured using ImageJ software. Mean plaque size data from three trials were averaged and a t-test was used to analyze significant differences between parental and cpnC− cells. C) Representative images of plaques. Scale bar = 3 mm.
Figure 4. Decreased adhesion of cpnC− cells is due to decreased cell-surface proteins. (A) Parental (black bars) and cpnC− (gray bars) cells were treated with LatA for 30 minutes in a shaking suspension and then incubated with 1 µm FITC beads for 15 minutes. Cells were washed in buffer with or without sodium azide (SA), fixed, and analyzed using flow cytometry. Mean cell fluorescence for each cell type and condition was normalized to the average mean cell fluorescence within each trial. Data from 3 trials (n = 10,000 cells per sample) were analyzed for significant differences between parental and cpnC− cells using a two-way ANOVA and post hoc Tukey comparisons, *indicates p < 0.05. (B) Cells were treated the same as in (A) and then fixed on coverslips, and imaged using DIC and fluorescence microscopy (scale bar = 16 µm). (C) Parental and cpnC− cells were incubated with LatA for 30 minutes in a shaking suspension then incubated with different concentrations of proteinase K for 15 minutes before adding beads for an additional 15 minutes. Cell samples were washed in buffer, fixed, and analyzed using flow cytometry. Mean cell fluorescence was normalized to the average fluorescence within each trial. Data from 3 trials (n = 10,000 cells per sample) were analyzed for significant differences between parental and cpnC− cells using a two-way ANOVA and post hoc Tukey comparisons, *indicates p < 0.05. (D) Cells were treated the same as in (C) and then fixed on coverslips, and imaged using DIC and fluorescence microscopy (scale bar = 16 µm). (E) Parental and cpnC− cells were incubated with FITC-Lactadherin for 15 minutes or incubated with calcium ionophore for 10 minutes, then FITC-Lactadherin. Cells samples were analyzed using flow cytometry and mean cell fluorescence was normalized to the average mean cell fluorescence for all cell types and conditions within each trial. Data from 4 trials (n = 10,000 cells per sample) were analyzed for significant differences between parental and cpnC− cells using a two-way ANOVA and post hoc Tukey comparisons.
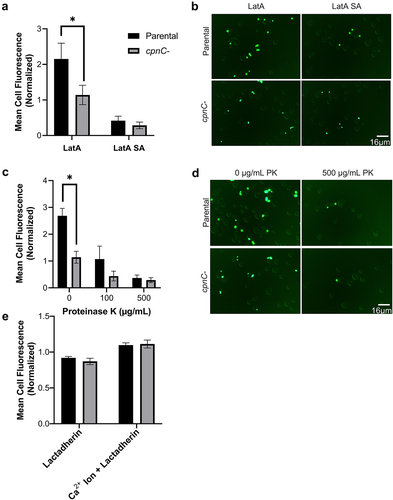
Figure 5. cpnC− cells exhibited decreased adhesion to plastic dishes. Parental (black bars) and cpnC− (gray bars) cells were plated on small petri dishes. Cells were imaged with phase-contrast microscopy at four marked spots before and after rotation at 100, 125, and 150 rpm. The number of cells in each image were counted and averaged. The percentage of detached cells after rotation was calculated by the subtraction of the average number of cells remaining after rotation from the average number of cells present before rotation divided by the number of cells present before rotation. Data from three trials was averaged and analyzed for significant differences between parental and cpnC− cells by a repeated measures two-way ANOVA and Sidak’s multiple comparisons, *indicates p < 0.05.
Figure 6. cpnC− cells aggregated without streaming and exhibited increased cell-cell adhesion. A) Parental and cpnC− cells were allowed to develop under starvation buffer. Images were taken every 2 minutes for 8 hours using a dissecting microscope. Representative images at 0, 2, 4, 6, and 8 hours are shown. Scale bar = 1000 µm. See accompanying time-lapse movies (S3 and S4). B) parental (circles) and cpnC- (squares) cells were allowed to develop under starvation buffer until the parental cells began streaming, approximately 6–8 hours. Cells were disrupted and the number of single cells and doublets were counted. Disrupted cells were incubated at 125 rpm shaking. Cell samples were counted for single cells and doublets at 30 and 60 minutes. The percentage of single cells and doublets was calculated by dividing the average number of singles/doublets at each timepoint by the number of singles/doublets immediately after disruption. Data from four trials were averaged and analyzed for significant differences between parental and cpnC− cells using a repeated measures two-way ANOVA and post hoc Tukey multiple comparisons, *indicates p < 0.05 at the 30 and 60 minute timepoints.
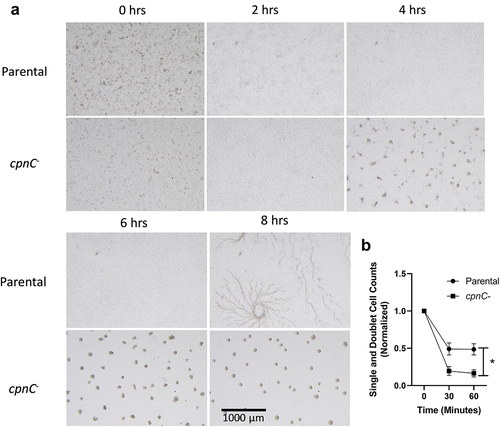
Figure 7. cpnC- cells have decreased SibA expression as vegetative cells and increased CsaA expression as starved cells. Parental and cpnC− cells were allowed to develop under starvation buffer. Whole cell samples were made at 0, 2, 4, 6, 8, and 10 hours post starvation. Whole cell samples were analyzed by western blot with an antibody to SibA (A,B,C) and CsaA (D,E,F). The SibA and CsaA bands on blots from three trials were analyzed by densitometry. Mean densities were analyzed by a two-way ANOVA and post-hoc fisher LSD comparisons. A) SibA mean band densities for parental (black bars) and cpnC− (gray bars) cells at each timepoint. Mean densities were normalized to the parental cell SibA band at the 0 timepoint. B) Representative image of a SibA western blot with parental (P) and cpnC− (C-) whole cell samples. C) SibA western blot comparing parental, sibA− and cpnC− cells at the 0 timepoint. D) CsaA mean band densities for parental (black bars) and cpnC− (gray bars) cells at each timepoint. Mean densities were normalized to the parental cell CsaA band at the 10 hour timepoint. E) Representative image of a CsaA western blot with parental (P) and cpnC− (C-) whole cell samples. F) CsaA western blot comparing whole cell samples from parental, cpnC−, and csaA− cells at the 6 hour timepoint.
Figure 8. cpnC− cells exhibit decreased expression of RegA. Parental and cpnC− cells were allowed to develop under starvation buffer. Whole cell samples were made at 0 and 6 hours post starvation. Whole cell samples were analyzed by western blot with an antibody to RegA. The RegA bands on blots from three trials were analyzed by densitometry. Mean densities were analyzed by a two-way ANOVA and post-hoc fisher LSD comparisons. A) RegA mean band densities for parental (black bars) and cpnC− (gray bars) cells at each timepoint. Mean densities were normalized to average density within each trial. B) Representative image of a RegA western blot with parental (P) and cpnC− (C-) whole cell samples.