
Figures & data
Figure 1. Elevated PIK3R6 expression in CCRCC linked to adverse progression. (a–e) the difference of PIK3R6 mRNA expression among CCRCC tissues and adjacent tissues was analyzed based on sample types, tumor stage, tumor grade, tumor subtype, and tumor metastasis states. (f) TCGA database analysis on UALCAN website showed the relationship between PIK3R6 expression and the patients’ survival rate.
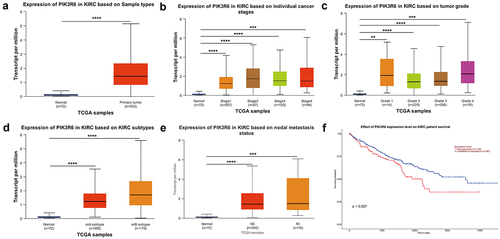
Figure 2. PIK3R6 protein level was upregulated in CCRCC. (a) Representative immunohistochemical images are presented about PIK3R6 expression in CCRCC and paired para-carcinoma tissues. (b) PIK3R6 expression is significantly higher in the CCRCC tissues than that in the paired para-carcinoma tissues (n = 20; ***p < .001).
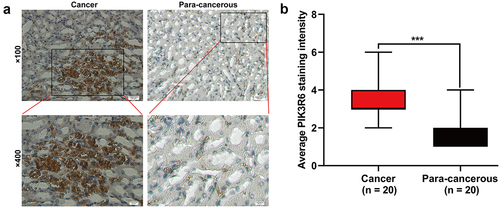
Figure 3. PIK3R6 silencing suppressed the proliferation of CCRCC cells in vitro. 786-O and ACHN cells were transfected with si-PIK3R6#1, si-PIK3R6#2 or si-NC for 48 h. (a) Quantitative real time PCR and (b) western blot analysis showed efficient knockdown of PIK3R6 in 786-O and ACHN cells. (c) CCK-8 assay showed the cell viability of the si-PIK3R6#1 or si-NC group in 786-O and ACHN cells after 24 h, 48 h and 72 h incubation. The effects of PIK3R6 knockdown on cell proliferation were assessed by colony formation assay (d) and edu staining (e) in 786-O and ACHN cells. The data were shown as the mean ± SD. *p < .05, **p < .01, ***p < .001, compared with si-NC.
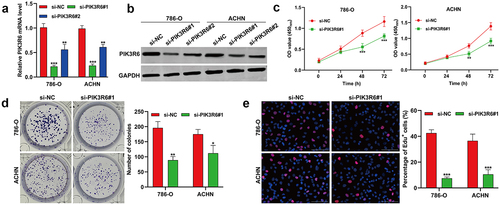
Figure 4. PIK3R6 silencing induced G0/G1 phase arrest and apoptosis in CCRCC cells. 786–O and ACHN cells were transfected with si-PIK3R6#1 or si-NC for 48 h. (a–b) the effects of si–PIK3R6#1 transfection on cell cycle distribution were determined in 786–O and ACHN cells. The representative results of cell cycle were shown in left panel and corresponding quantification of cell cycle distribution was depicted in right panel. (c-d) the effects of si-PIK3R6#1 transfection on apoptotic rate were determined in 786-O and ACHN cells. The representative results of cell apoptosis were shown in left panel and corresponding quantification of cell cycle distribution was depicted in right panel. The data were shown as the mean ± SD. *p < .05, **p < .01, ***p < .001, compared with si–NC.
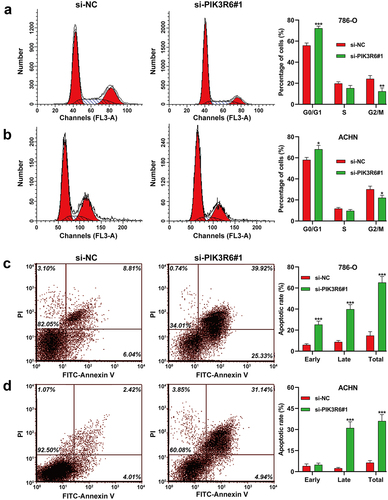
Figure 5. PIK3R6 silencing inhibited the migratory and invasive ability of CCRCC cells. 786–O and ACHN cells were transfected with si-PIK3R6#1 or si–NC for 48 h. (a–b) Cell migration was determined in transfected 786-O and ACHN cells by wound healing assay. (c–d) Cell invasion was determined in transfected 786-O and ACHN cells by transwell invasion assay. The data were shown as the mean ± SD. **p < .01, ***p < .001, compared with si-NC.
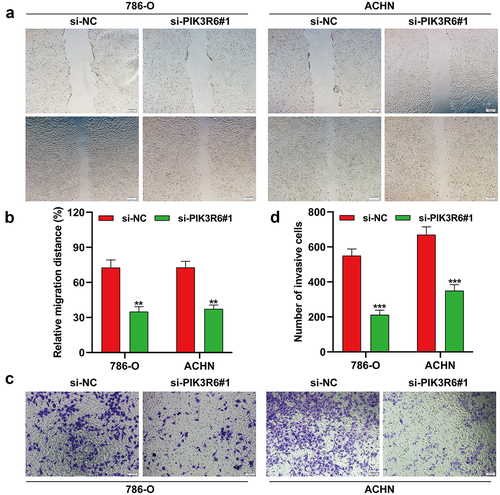
Figure 6. PIK3R6 silencing modulated growth and metastasis indicators in CCRCC cells. 786–O and ACHN cells were transfected with si-PIK3R6#1 or si–NC for 48 h. (a) The protein levels of CDK4, cyclin D1, Bax, Bcl-2 and cleaved caspase-3 were detected in transfected 786–O and ACHN cells. (b) The protein levels of E-cadherin, N-cadherin, Vimentin, p–PI3K, PI3K, p–AKT and AKT were detected in transfected 786–O and ACHN cells. The data were shown as the mean ± SD. *p < .05, **p < .01, ***p < .001, compared with si-NC.
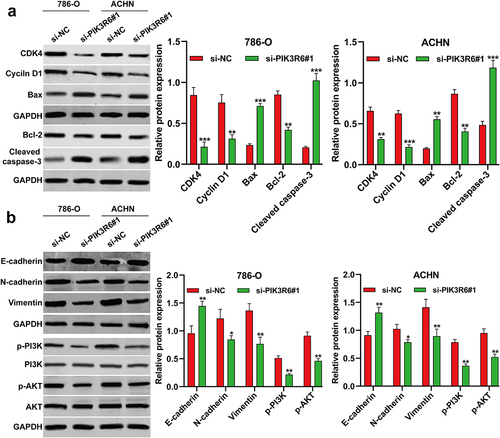
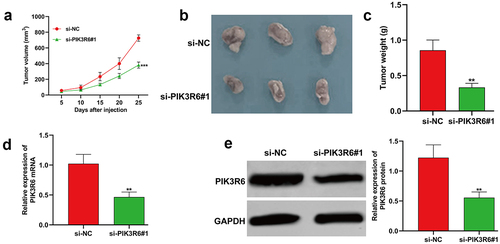
Figure 7. PIK3R6 silencing repressed the tumor growth of CCRCC cells in vivo. 7786-O cells grew as subcutaneous tumors in si-PIK3R6#1 and si-NC groups of BALB/c athymic nude mice (representative 3 mice per group) for 25 days. (a) Tumor volume, (b) xenograft tumors, and quantitative results (c) of tumor weight from two groups. (d-e) the expression levels of PIK3R6 mRNA and protein were determined in tumor tissues was determined. The data were shown as the mean ± SD. **p < .01, ***p < .001, compared with si-NC.
Data availability statement
Data will be made available by the corresponding author upon reasonable request.