
Figures & data
Figure 1. Reverse translational research using Drosophila.
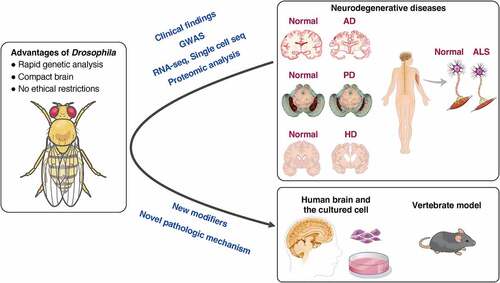
Table 1. Example of reverse translational researches.
Figure 2. Traditional methods for evaluating neurodegeneration using Drosophila. (A) The dorsal view of the head of Drosophila and a cross-sectional view of the visual system. 700–800 ommatidia are aligned in the retina. Each ommatidium has 8 types of photoreceptors: R1-6 project their axons to the first optic ganglion lamina, and R7-8 project their axons to the second optic ganglion medulla to transmit light information to the brain. (B-D) Structural defects observed in Drosophila compound eye (B), pseudopupil loss (C), and the retinal thickness and vacuolization (D) provide simple methods for evaluating the cytotoxicity of disease-associated proteins. (E) Life span analysis. The Kaplan-Meier survival curve is used to compare the lifespan of different groups.
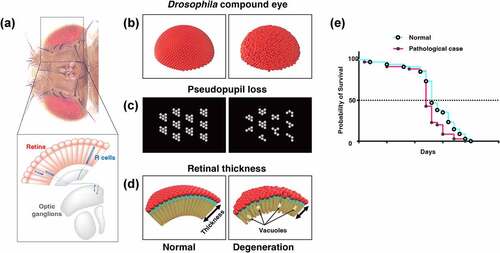
Figure 3. Evaluation methods of neural function using Drosophila. (A) Climbing assay. It is a measurement of motor function taking advantage of the fly’s negative geotaxis. (B) Olfactory memory assay using T-maze. At the training phase, unconditioned stimulus (US) such as electric shock and sweetness such as sucrose is associated with the odour in the training tube. Next, another odour is presented, without US. In the test phase, the two odours used in the training are presented to the trained fly from both ends of the test tube, and the performance index is quantified by which odour attracted the fly. In the figure, the associative learning between odour A and electric shock, called aversive learning, leads to the learning flies avoiding odour A. (C) Schematic diagrams of Actogram. Actogram is a double-plotted graphical representation of the phases of an organism’s daily activity and resting time. Grey shading indicates the dark phase. In controls, the level of activity increases in the morning and evening, but when the circadian rhythm is disrupted by the expression of disease gene, this time-specific increase is not observed. (D) Schematic diagrams of ERG trace. In healthy flies (left panel), the ERG traces are derived from photoreceptor activity (depolarisation and repolarisation, white arrow heads in the figure) and from postsynaptic neuron activity (on-transient and off-transient, black arrow heads in the figure). When the pathological gene is expressed, the ERG trace can be used to estimate what part of the visual system is impaired.
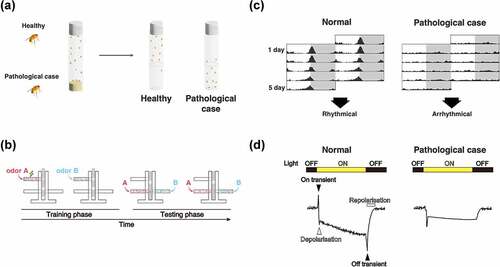
Figure 4. Cell types and experimental systems of Drosophila for evaluating the effects of disease protein toxicity on each region in neurone. (A) the number of cell bodies is quantified by visualisation of the dopaminergic or the cholinergic neurones. (B) The degeneration of neurites is evaluated in dendrite (dendritic arborisation neurone) and axons (wing nerve, leg motor neurone, photoreceptor neurone, and olfactory receptor neurone). (C) The number and the structure of synapse is quantified in neuromuscular junction, photoreceptor axon, and olfactory receptor neurone.
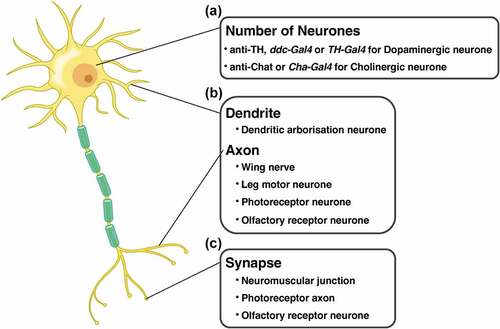
Table 2. The effect of pathological genes on the number of the neurones.