Figures & data
Figure 1. Exon 33+/− cardiomyocyte has similar CaV1.2 channel properties with WT cardiomyocyte. (A) The stimulus waveform was used to induce ICa of cardiomyocyte, briefly ICa was recorded under the different testing potentials, increased from −60 mV to 60 mV (10 mV increase each step) followed by 10 mV depolarizing-pulse to induce steady-state inactivation in cardiomyocytes when using the 1.8 mmol/L Ca2+ as charger carrier. (B) Exemplary current traces were recorded from WT (black), exon 33+/− (blue) or exon 33−/− (red) cardiomyocytes. (C) Current densities of CaV1.2 channels in WT (n = 11 cells, V0.5 = 2.82±2.3 mV), exon 33+/− (n = 20 cells, V0.5 = 3.18±1.7 mV) and exon 33−/− (n = 18 cells, V0.5 = −7.28±3.3 mV) cardiomyocytes (*P<0.05 vs. WT, unpaired t test). (D) Normalized current-voltage relationships of CaV1.2 channels in WT, exon 33+/− and exon 33−/− cardiomyocytes. (E) Steady-state inactivation of CaV1.2 channels in WT (n = 16 cells, V0.5,inact = −20.63±0.44 mV), exon 33+/− (n = 14 cells, V0.5,inact = −20.46±0.85 mV) and exon 33−/− (n = 12 cells, V0.5,inact = −31.94±0.64 mV) cardiomyocytes.
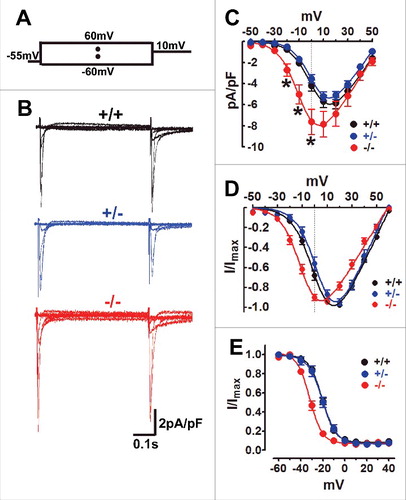
Figure 2. Exon 33+/− cardiomyocyte did not show any signs of abnormal excitations. (A) AP waveforms recorded from WT (black), exon 33+/− (blue) and exon 33−/− (red) cardiomyocytes. (B) APD after 90% of repolarization (APD90%) from WT (n = 11 cells), exon 33+/− (n = 14 cells) and exon 33−/− (n = 16 cells) (*P<0.05 vs. WT, unpaired t test). (C and D) Detection of EADs in cardiomyocytes of WT (n = 73 cells, 17 mice), exon 33+/− (n = 24 cells, 5 mice) or exon 33−/− mice (n = 73 cells, 16 mice) at a 0.5-Hz pacing rate. (P = 0.0139 one-way ANOVA; *P<0.05 vs. WT, Bonferroni post hoc test). (E and F) Detection of autonomous APs in cardiomyocytes from WT (n = 73 cells, 17 mice), exon 33+/− (n = 24 cells, 5 mice) and exon 33−/− (n = 73 cells, 16 mice) a 5-Hz pacing rate (P = 0.0052, one-way ANOVA; **P<0.01 vs. WT, Bonferroni post hoc test).
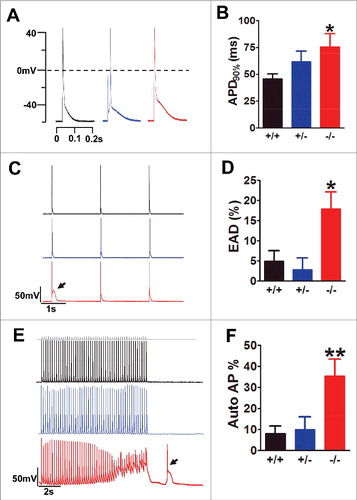
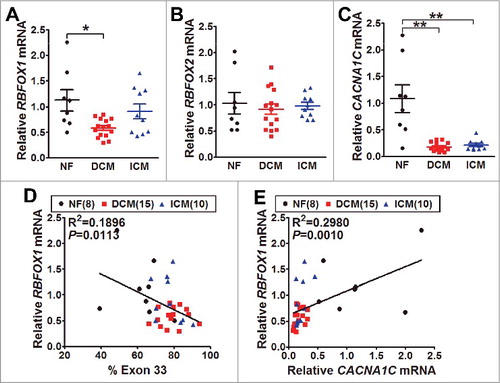
Figure 3. The mRNA expression of Rbfox1/2 and CaV1.2 α1C in human hearts. (A) The mRNA levels of Rbfox1 were measured by real-time RT-PCR from the samples of human normal (NF, black, n = 8), dilated cardiomyopathy (DCM, red, n = 15) and ischemic cardiomyopathy (ICM, blue, n = 10) hearts. The relative expression was normalized by internal expression of human GAPDH and RPLPO mRNA (P = 0.0103, one-way ANOVA; *P<0.05 vs. WT, Bonferroni post hoc test). (B) The mRNA levels of Rbfox2 were also measured by real-time RT-PCR from NF (n = 8), DCM (n = 15) and ICM (n = 10) hearts. (C) CaV1.2 α1C mRNA expression was measured by real-time RT-PCR from NF (n = 8), DCM (n = 15) and ICM (n = 10) hearts (**P<0.01, one-way ANOVA; **P<0.01 vs. WT, Bonferroni post hoc test). The correlations between alternative exon 33 expression and Rbfox1 (D) or CaV1.2 α1C (E) mRNA level in human hearts were analyzed by linear regression, R2 refers to the coefficient of determination.