Figures & data
Table 1. The type of the retrieved document.
Table 2. The type of the languages encountered in retrieved documents.
Figure 1. Flow diagram of sodium channel researches inclusion.
Figure 2. Publication outputs and growth prediction. (a). The number of annual publications on sodium channel research from 2013 to 2017; (b). The line chart of different countries on sodium channel publications trend.
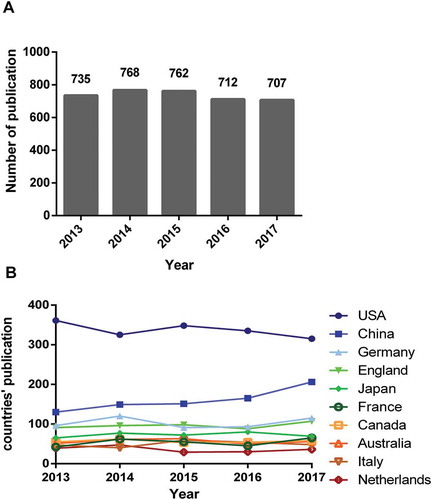
Figure 3. The publications, citation counts (× 0. 1), and H-index in the top 10 countries.
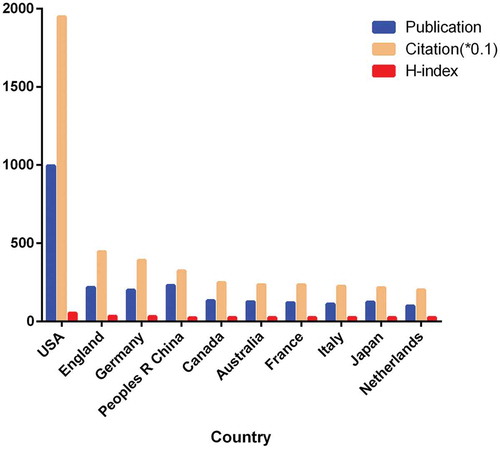
Table 3. The top 10 countries and institutions contributed to publications on sodium channel research.
Figure 4. Worldwide publications analysis (a). The pie chart of research on sodium channel by different regions; (b). Geographic distribution of different countries.
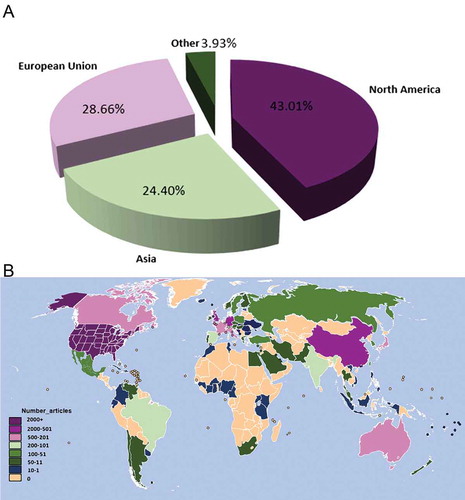
Figure 5. The analysis of countries and institutions. (a). Network of countries/territories engaged in sodium channel research; (b). Network of institutions engaged in sodium channel research.
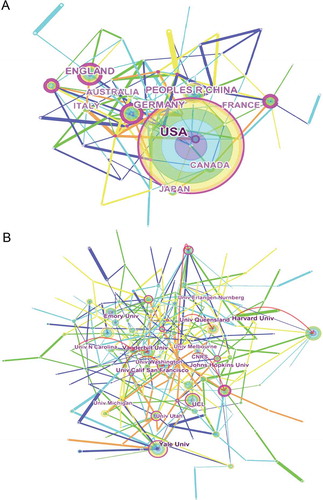
Table 4. The Top 10 journals that published articles on sodium channel research.
Figure 6. The dual-map overlay of journals related to sodium channel research.
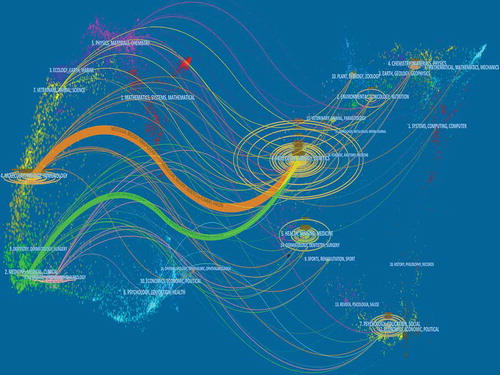
Figure 7. The analysis of authors. (a) Network of authors contributed to sodium channel research; (b) Network of co-cited authors engaged in sodium channel research.
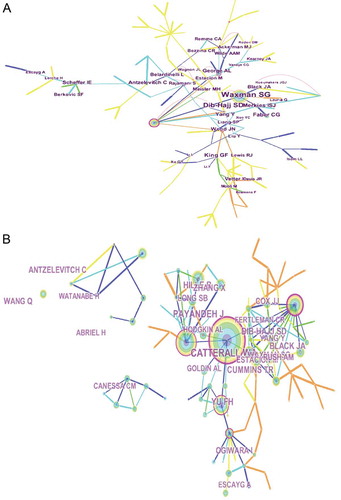
Table 5. The Top 10 authors, co-cited authors, and co-cited references on sodium channel research.
Figure 8. The analysis of references. (a) Co-citation network of references from publications on sodium channel research; (b) Co-citation network (timeline) of references from publications on sodium channel research.
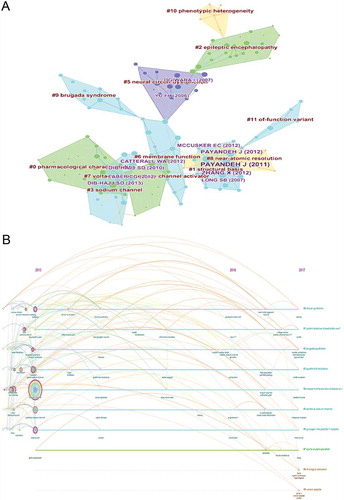
Figure 9. The analysis of keywords on sodium channel research.
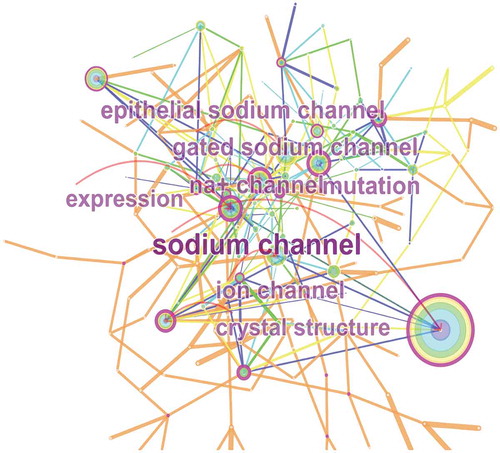
Figure 10. The keywords with the strongest citation bursts of publications on sodium channel research.
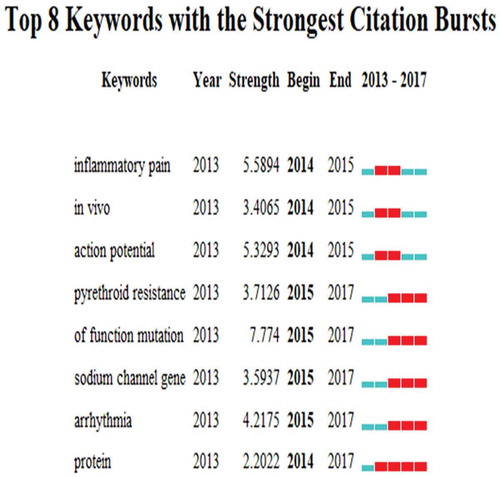
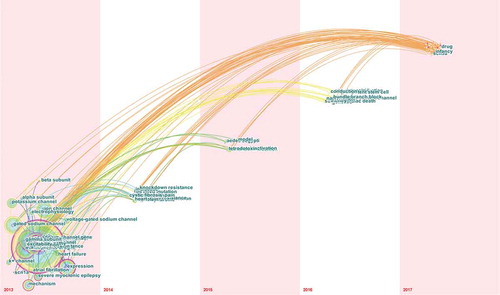
Figure 11. Keywords network (time zone) from publications on sodium channel research.