
Figures & data
Figure 1. Transmembrane topology of the Cav1.3 α1-subunit. The pore-forming subunit of voltage gated Ca2+ channels consist of four transmembrane repeats each comprising six membrane spanning helices connected by intra- and extracellular linkers. Segments (S) 1–4 of each repeat comprise the voltage- sensing domain, whereas segments 5–6 line the pore. The positions of missense mutations identified in ASD (G407R, A749G) and APAs (F747L, R990H, M1354I) are indicated. Mutations G407R (IS6), F747L (IIS6) and A749G (IIS6) reside within the so-called activation gate at the distal part of the S6 segment. Mutation R990H affects the third of the five gating charges within the IIIS4 helix of the voltage sensing domain and M1354I is localized at the distal part of segment IVS5 facing the extracellular side. For references see text.
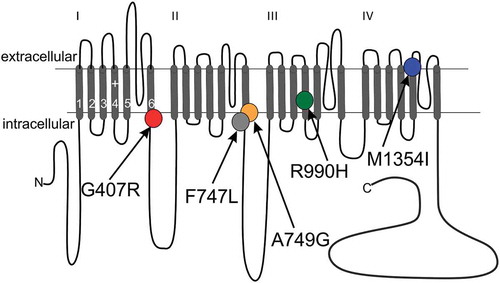
Table 1. Activation and inactivation parameters for ASD mutations A749G and G407R.
Table 2. Remaining current upon 5-s depolarization for ASD mutations A749G and G407R.
Table 3. Activation and inactivation parameters for APA mutations F747L and M1354I.
Table 4. Remaining current upon 5-s depolarization for APA mutations F747L and M1354I.
Table 5. Activation and inactivation parameters for APA mutation R990H.
Figure 2. Biophysical properties of Cav1.3 mutant A749GS. (a) Current-voltage relationships (ICa, mean ± S.E.M.; 50-ms depolarizations to indicated voltages) of WTS and A749GS. Only WT data recorded in parallel on the same days (> 3- different transfections) were included. Inset (upper): Box plots of WTS and A749GS peak current densities. In contrast to the long splice variant, no significant difference was observed in the current amplitudes (median, 5/95 percentile, [pA/pF]): WTS: −8.74 (−22.4/-5.54) n = 10; A749GS: −6.18 (−26.4/-4.94), n = 12; p = 0.339, Mann Whitney test). Inset (lower): Representative ICa traces from WTS and A749GS during depolarizations to Vmax. (b) Steady-state activation (circles, solid lines) and inactivation (squares, dashed lines) of WTS (black symbols) and A749GS (orange symbols). For statistics and n-numbers see . Lines without symbols represent the corresponding voltage-dependence of activation and inactivation for full length WTL and A749GL recorded under identical conditions (taken from reference Citation10). (c) Inactivation time course of WTS (n = 35) and A749GS (n = 9) during depolarization to Vmax for 5 s. Normalized traces are shown as mean ± S.E.M. Inactivation was best described by a bi-exponential decay. The faster inactivation of the mutant resulted from a slightly larger contribution of the fast inactivating component (WTS: 79.1 ± 1.11 %, n = 26, A749GS: 84.3 ± 2.21 %, p = 0.036, n = 8) and faster inactivation of the slow component (WTS: τslow = 602 ± 21.8 ms, A749GS: 420 ± 59.6 ms, p = 0.0012), despite a moderately slower fast inactivation (WTS: τfast = 36.5 ± 1.8 ms, A749GS: 57.9 ± 7.99 ms, p = 0.0004). Additionally, inactivation was more complete in the mutant (remaining current: WTS: 14.6 ± 2.5 %, A749GS: 5.65 ± 1.19 %, p = 0.061, for statistics see ). Statistical significance has been determined by unpaired Student’s t-test.
![Figure 2. Biophysical properties of Cav1.3 mutant A749GS. (a) Current-voltage relationships (ICa, mean ± S.E.M.; 50-ms depolarizations to indicated voltages) of WTS and A749GS. Only WT data recorded in parallel on the same days (> 3- different transfections) were included. Inset (upper): Box plots of WTS and A749GS peak current densities. In contrast to the long splice variant, no significant difference was observed in the current amplitudes (median, 5/95 percentile, [pA/pF]): WTS: −8.74 (−22.4/-5.54) n = 10; A749GS: −6.18 (−26.4/-4.94), n = 12; p = 0.339, Mann Whitney test). Inset (lower): Representative ICa traces from WTS and A749GS during depolarizations to Vmax. (b) Steady-state activation (circles, solid lines) and inactivation (squares, dashed lines) of WTS (black symbols) and A749GS (orange symbols). For statistics and n-numbers see Table 1. Lines without symbols represent the corresponding voltage-dependence of activation and inactivation for full length WTL and A749GL recorded under identical conditions (taken from reference Citation10). (c) Inactivation time course of WTS (n = 35) and A749GS (n = 9) during depolarization to Vmax for 5 s. Normalized traces are shown as mean ± S.E.M. Inactivation was best described by a bi-exponential decay. The faster inactivation of the mutant resulted from a slightly larger contribution of the fast inactivating component (WTS: 79.1 ± 1.11 %, n = 26, A749GS: 84.3 ± 2.21 %, p = 0.036, n = 8) and faster inactivation of the slow component (WTS: τslow = 602 ± 21.8 ms, A749GS: 420 ± 59.6 ms, p = 0.0012), despite a moderately slower fast inactivation (WTS: τfast = 36.5 ± 1.8 ms, A749GS: 57.9 ± 7.99 ms, p = 0.0004). Additionally, inactivation was more complete in the mutant (remaining current: WTS: 14.6 ± 2.5 %, A749GS: 5.65 ± 1.19 %, p = 0.061, for statistics see Table 2). Statistical significance has been determined by unpaired Student’s t-test.](/cms/asset/69d567c2-4165-4698-8cff-48874e201a6e/kchl_a_1546518_f0002_oc.jpg)
Figure 3. Biophysical properties of Cav1.3 mutant G407RS. (a) Current-voltage relationships (ICa, mean ± S.E.M.) from WTS and G407RS recorded in parallel on the same days (>3-different transfections). Inset (upper): Box plots showing significantly reduced peak current densities for G407RS (median (5/95 percentile) [pA/pF]: WTS: −6.68 (−17.1/-3.09), n = 17; G407RS: −2.82 (−4.36/-1.46), n = 13; *** p < 0.0001, Mann Whitney test). Inset (lower): Representative ICa traces of WTS and G407RS upon depolarization to Vmax. (b) Voltage dependence of WT (black circles) and G407RS (red circles) activation. Lines without symbols depict the corresponding voltage-dependence of activation for full length WTL (black) and G407RL (red) recorded under identical conditions (taken from reference Citation10). Statistics for gating parameters are given in . (c) Normalized inactivation time course of ICa after 5-s depolarization to Vmax (mean ± S.E.M.). The fast inactivating component is reduced in G407RS (n = 8) as compared to WT (n = 35) leading to slower inactivation of the mutant (for statistics see ). (d) Although G407RS maximal current density is significantly smaller than WTS, absolute G407RS current is larger than WTS after about 200 ms.
![Figure 3. Biophysical properties of Cav1.3 mutant G407RS. (a) Current-voltage relationships (ICa, mean ± S.E.M.) from WTS and G407RS recorded in parallel on the same days (>3-different transfections). Inset (upper): Box plots showing significantly reduced peak current densities for G407RS (median (5/95 percentile) [pA/pF]: WTS: −6.68 (−17.1/-3.09), n = 17; G407RS: −2.82 (−4.36/-1.46), n = 13; *** p < 0.0001, Mann Whitney test). Inset (lower): Representative ICa traces of WTS and G407RS upon depolarization to Vmax. (b) Voltage dependence of WT (black circles) and G407RS (red circles) activation. Lines without symbols depict the corresponding voltage-dependence of activation for full length WTL (black) and G407RL (red) recorded under identical conditions (taken from reference Citation10). Statistics for gating parameters are given in Table 1. (c) Normalized inactivation time course of ICa after 5-s depolarization to Vmax (mean ± S.E.M.). The fast inactivating component is reduced in G407RS (n = 8) as compared to WT (n = 35) leading to slower inactivation of the mutant (for statistics see Table 2). (d) Although G407RS maximal current density is significantly smaller than WTS, absolute G407RS current is larger than WTS after about 200 ms.](/cms/asset/9d16fadd-aada-4211-8052-21cc72d5288e/kchl_a_1546518_f0003_oc.jpg)
Figure 4. Biophysical properties of Cav1.3 mutant F747LL. (a) Current-voltage relationships (ICa, mean ± S.E.M.) of WTL and F747LL recorded in parallel on the same days (>3-different transfections). Inset (upper): Box plots of peak current densities (median, 5/95 percentile, [pA/pF]): WTL: −12.7 (−66.1/-5.96), n = 47; F747LL: −13.3 (−40.3/-3.97), n = 27). Black circles represent extreme values. Peak values were not statistically different (Mann Whitney test, p = 0.97). Inset (lower): Representative ICa traces of WTL and F747LL upon depolarization to Vmax. Note the slower activation time course and the absence of QON gating charge in F747LL (arrows). (b) Steady-state activation (circles, solid lines) and inactivation (squares, dashed lines) of WTL (black symbols) and F747LL (gray symbols). Gating parameters and statistics are given in . (c) Normalized inactivation time course of ICa after 5-s depolarization to Vmax (mean ± S.E.M.) illustrating pronounced slowing of inactivation by F747L.(n = 10) as compared to WTL (n = 28). For statistics, see .
![Figure 4. Biophysical properties of Cav1.3 mutant F747LL. (a) Current-voltage relationships (ICa, mean ± S.E.M.) of WTL and F747LL recorded in parallel on the same days (>3-different transfections). Inset (upper): Box plots of peak current densities (median, 5/95 percentile, [pA/pF]): WTL: −12.7 (−66.1/-5.96), n = 47; F747LL: −13.3 (−40.3/-3.97), n = 27). Black circles represent extreme values. Peak values were not statistically different (Mann Whitney test, p = 0.97). Inset (lower): Representative ICa traces of WTL and F747LL upon depolarization to Vmax. Note the slower activation time course and the absence of QON gating charge in F747LL (arrows). (b) Steady-state activation (circles, solid lines) and inactivation (squares, dashed lines) of WTL (black symbols) and F747LL (gray symbols). Gating parameters and statistics are given in Table 3. (c) Normalized inactivation time course of ICa after 5-s depolarization to Vmax (mean ± S.E.M.) illustrating pronounced slowing of inactivation by F747L.(n = 10) as compared to WTL (n = 28). For statistics, see Table 4.](/cms/asset/7e63e110-05ac-4407-aa59-d40cecbf25b9/kchl_a_1546518_f0004_b.gif)
Table 6. Remaining current upon 5-s depolarization for APA mutation R990H.
Figure 5. Biophysical properties of Cav1.3 mutant R990HS. (a) Current-voltage relationships (ICa, mean ± S.E.M.) from WTS and R990HS recorded in parallel on the same days (>3-different transfections). Inset (upper): Box plots of peak current densities (median (5/95 percentile, [pA/pF]): WTS: −7.96 (−39.2/-3.03), n = 10; R990HS: −10.8 (−29.8/-4.65), n = 11; p = 0.549, Mann Whitney test). Inset (lower): Representative ICa traces of WTS and R990HS upon depolarization to Vmax. (b) Steady-state activation (circles, solid lines) and inactivation (squares, dashed lines) of WTS and R990HS. For statistics and n-numbers see . Lines without symbols depict the corresponding voltage-dependence of activation and inactivation for full length WTL and R990HL for comparison [Citation21] (c) Normalized inactivation time course of ICa after 5-s depolarization to Vmax (mean ± S.E.M.) for WTS (n = 35) and R990HS (n = 9). For statistics, see .
![Figure 5. Biophysical properties of Cav1.3 mutant R990HS. (a) Current-voltage relationships (ICa, mean ± S.E.M.) from WTS and R990HS recorded in parallel on the same days (>3-different transfections). Inset (upper): Box plots of peak current densities (median (5/95 percentile, [pA/pF]): WTS: −7.96 (−39.2/-3.03), n = 10; R990HS: −10.8 (−29.8/-4.65), n = 11; p = 0.549, Mann Whitney test). Inset (lower): Representative ICa traces of WTS and R990HS upon depolarization to Vmax. (b) Steady-state activation (circles, solid lines) and inactivation (squares, dashed lines) of WTS and R990HS. For statistics and n-numbers see Table 5. Lines without symbols depict the corresponding voltage-dependence of activation and inactivation for full length WTL and R990HL for comparison [Citation21] (c) Normalized inactivation time course of ICa after 5-s depolarization to Vmax (mean ± S.E.M.) for WTS (n = 35) and R990HS (n = 9). For statistics, see Table 6.](/cms/asset/94b11069-6097-48b2-85c6-f1cde3128f0d/kchl_a_1546518_f0005_oc.jpg)
Figure 6. Biophysical properties of Cav1.3 mutant M1354I. (a) Current-voltage relationships (ICa, mean ± S.E.M.) of WTL and M1354IL recorded in parallel on the same days (>3-different transfections). Inset (upper): Box plots of peak current densities (median, 5/95 percentile, [pA/pF]): WTL: −10.9 (−72.3/-5.86) n = 38; M1354IL: −8.33 (−25.3/-4.44), n = 40) were significantly smaller for the mutant (Mann Whitney test, p = 0.029). Inset (lower): Representative ICa traces of WTL and M1354IL upon depolarization to Vmax. (b) Current-voltage relationships (ICa, mean ± S.E.M.) of WTS and M1354IS recorded in parallel on the same days (>3-different transfections). Inset (upper): peak current densities (median, 5/95 percentile, [pA/pF]): WTS: −7.50 (−28.5/-3.63), n = 30; M1354IS: −5.89 (−12.6/-3.00), n = 19) were significantly smaller for the mutant (Mann Whitney test, p = 0.037). Inset (lower): Representative ICa traces of WTS and M1354IS upon depolarization to Vmax. (c) M1354I steady-state activation (circles, solid lines) and inactivation (squares, dashed lines) of WTL (filled black symbols), M1354IL (filled blue symbols), WTS (open black symbols), and M1354IS (open blue symbols). No significant changes were observed in mutant channels. Gating parameters and statistics are given in . (d) Recovery from ICa inactivation (mean ± S.E.M.) of WTL and M1345IL. First 300 ms are magnified in the inset. Curves were fitted using a mono-exponential function; there was no difference in the time constants (τ as mean ± S.E.M [ms]: WTL: 166.1 ± 20.6, n = 5; M1354IL: 154.5 ± 42.5, n = 5; unpaired Student’s t-test). E: Fraction of Imax remaining after repetitive depolarizations to Vmax at 3 Hz (mean ± S.E.M.) of WTL (n = 10) versus M1345IL (n = 5). (f) Normalized inactivation time course of ICa after 5-s depolarization to Vmax (mean ± S.E.M.) of WTL (n = 35) and M1354IS (n = 9). For statistics, see .
![Figure 6. Biophysical properties of Cav1.3 mutant M1354I. (a) Current-voltage relationships (ICa, mean ± S.E.M.) of WTL and M1354IL recorded in parallel on the same days (>3-different transfections). Inset (upper): Box plots of peak current densities (median, 5/95 percentile, [pA/pF]): WTL: −10.9 (−72.3/-5.86) n = 38; M1354IL: −8.33 (−25.3/-4.44), n = 40) were significantly smaller for the mutant (Mann Whitney test, p = 0.029). Inset (lower): Representative ICa traces of WTL and M1354IL upon depolarization to Vmax. (b) Current-voltage relationships (ICa, mean ± S.E.M.) of WTS and M1354IS recorded in parallel on the same days (>3-different transfections). Inset (upper): peak current densities (median, 5/95 percentile, [pA/pF]): WTS: −7.50 (−28.5/-3.63), n = 30; M1354IS: −5.89 (−12.6/-3.00), n = 19) were significantly smaller for the mutant (Mann Whitney test, p = 0.037). Inset (lower): Representative ICa traces of WTS and M1354IS upon depolarization to Vmax. (c) M1354I steady-state activation (circles, solid lines) and inactivation (squares, dashed lines) of WTL (filled black symbols), M1354IL (filled blue symbols), WTS (open black symbols), and M1354IS (open blue symbols). No significant changes were observed in mutant channels. Gating parameters and statistics are given in Table 3. (d) Recovery from ICa inactivation (mean ± S.E.M.) of WTL and M1345IL. First 300 ms are magnified in the inset. Curves were fitted using a mono-exponential function; there was no difference in the time constants (τ as mean ± S.E.M [ms]: WTL: 166.1 ± 20.6, n = 5; M1354IL: 154.5 ± 42.5, n = 5; unpaired Student’s t-test). E: Fraction of Imax remaining after repetitive depolarizations to Vmax at 3 Hz (mean ± S.E.M.) of WTL (n = 10) versus M1345IL (n = 5). (f) Normalized inactivation time course of ICa after 5-s depolarization to Vmax (mean ± S.E.M.) of WTL (n = 35) and M1354IS (n = 9). For statistics, see Table 4.](/cms/asset/2d8f9ead-aab0-4bca-b1ef-e92ea5cc1410/kchl_a_1546518_f0006_oc.jpg)
Table 7. Classification of CACNA1D missense mutations by characteristic functional changes.