
Figures & data
Figure 1. Amphipathic compounds inhibit voltage-gated Na+ currents from NaV1.5 channels expressed in HEK293 cells. (a), Molecular structures of the amphipaths (from left to right): amiodarone, capsaicin, propranolol, and Triton X-100. (b-c), Representative Na+ currents elicited by a step from −120 to the −35-mV test voltage (b), and peak Na+ current-voltage plots across all test voltages (c) with 10−9 to 10−[Citation4] M (blue-red spectrum) of membrane-permeable amphipathic compounds in the extracellular solution. (d), Dose-response curves for maximum peak Na+ current of NaV1.5 vs. amphipathic concentration; IC50 values: amiodarone, 8.4 µM; capsaicin, 60.2 µM; propranolol, 7.6 µM; Triton X-100, 5.3 µM.
![Figure 1. Amphipathic compounds inhibit voltage-gated Na+ currents from NaV1.5 channels expressed in HEK293 cells. (a), Molecular structures of the amphipaths (from left to right): amiodarone, capsaicin, propranolol, and Triton X-100. (b-c), Representative Na+ currents elicited by a step from −120 to the −35-mV test voltage (b), and peak Na+ current-voltage plots across all test voltages (c) with 10−9 to 10−[Citation4] M (blue-red spectrum) of membrane-permeable amphipathic compounds in the extracellular solution. (d), Dose-response curves for maximum peak Na+ current of NaV1.5 vs. amphipathic concentration; IC50 values: amiodarone, 8.4 µM; capsaicin, 60.2 µM; propranolol, 7.6 µM; Triton X-100, 5.3 µM.](/cms/asset/582f8646-8ab1-4771-af50-e2ac3f6934da/kchl_a_2026015_f0001_oc.jpg)
Figure 2. Capsaicin inhibits pressure- and shear-sensitivity of NaV1.5. (a), Representative NaV1.5 currents elicited by voltage ladders ranging −100 to 0 mV in a cell-attached patch (a) or −120 mV to −30 mV in a whole cell (b), recorded at rest (filled symbols) or with force (empty symbols), in the presence of 0 µM (black) or 20 µM capsaicin (red). Difference currents were constructed by subtracting the control Na+ currents from the pressure- (a) or shear-stimulated (b) currents. (c-d), Steady-state activation (c) and inactivation (d) curves of Na+ currents in cell-attached patches (left) or whole cells (right), recorded at rest (filled symbols) or with force (empty symbols), in the presence of 0 µM (black) or 20 µM capsaicin (red). (e-h), Maximum peak Na+ current (e), time constant of activation (f), and voltage dependence of activation (g, V1/2A) or inactivation (h, V1/2I), recorded with 0 or −30 mmHg pressure in the patch (left) and 0 or 10 mL/min flow rate in whole cells (right) in the presence of 0 µM (black) or 20 µM capsaicin (red). n = 12–24 cells, *P < 0.05 comparing 0 to −30 mmHg or 0 to 10 mL/min, †P < 0.05 comparing 0 to 20 µM capsaicin by a 2-way ANOVA with Tukey posttest.
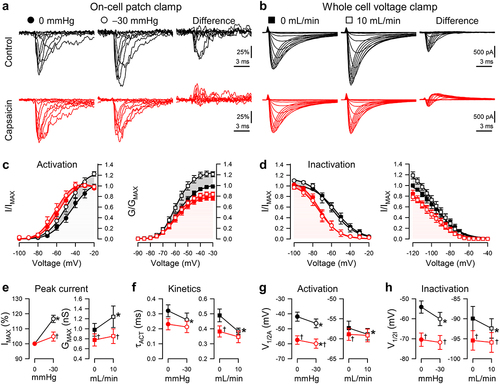
Figure 3. Effects of capsaicin on mechanosensitivity of NaV1.5 inactivation recovery time. (a-b), Representative NaV1.5 currents at −20 mV in a cell-attached patch (a, ●) or −30 mV in a whole cell (b, ■), elicited after recovering from the control step for 3–300 ms at −120 mV (a) or 3–1000 ms at −130 mV (b). Na+ currents were recorded at rest (gray) or with force (black and red traces: a, −30 mmHg pressure; b, 10 mL/min shear stress) in the presence of 0 µM (top) or 20 µM capsaicin (bottom). (c-d), Normalized peak Na+ current versus recovery time in the presence of 0 µM (black) or 20 µM capsaicin (red), at 0 (●) or −30 mmHg pressure (○) in the patch (c) or at 0 (■) or 10 mL/min (□) shear stress in whole cells (d). (e-f), Inactivation recovery times (t1/2) versus 0 or −30 mmHg pressure in the patch (e) and 0 or 10 mL/min shear stress in whole cells (f) with 0 µM (black) or 20 µM capsaicin (red). n = 8–11 cells, *P < 0.05 comparing 0 to −30 mmHg or 0 to 10 mL/min, †P < 0.05 comparing 0 to 20 µM capsaicin by a 2-way ANOVA with Tukey posttest.
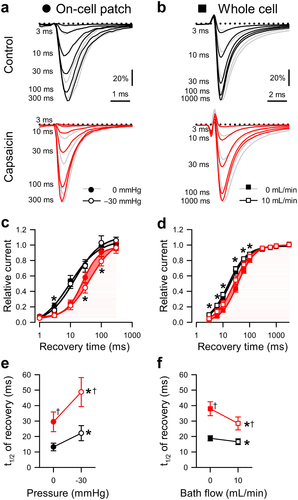
Figure 4. Effects of capsaicin on mechanosensitivity of NaV1.5 use-dependent inactivation. (a-b), Representative NaV1.5 currents at the 20th step to −20 mV in a cell-attached patch (A, ·) or to −40 mV in a whole cell (b, ■), elicited at intersweep frequencies 3–33 Hz (a) or 3–50 Hz (b). Na+ currents were recorded at rest (gray) or with force (black and red traces: a, −30 mmHg pressure; b, 10 mL/min shear stress) in the presence of 0 µM (top) or 20 µM capsaicin (bottom). (c-d), Use-dependent inhibition of peak Na+ current versus intersweep frequency in the presence of 0 µM (black) or 20 µM capsaicin (red), at 0 (●) or −30 mmHg pressure (○) in the patch (c) or at 0 (■) or 10 mL/min (□) shear stress in whole cells (d). (e-f), Maximum use-dependent inhibition (e) or frequency of use-dependent inhibition (f) versus pressure in the patch (left) and shear stress in whole cells (right) with 0 µM (black) or 20 µM capsaicin (red). n = 8–18 cells, *P < 0.05 comparing 0 to −30 mmHg or 0 to 10 mL/min, †P < 0.05 comparing 0 to 20 µM capsaicin by a 2-way ANOVA with Tukey posttest.
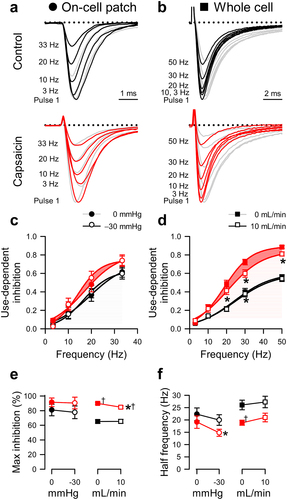
Table 1. Partition coefficients and IC50 values for amphipathic agents. Partition coefficients denoted logPOW for amiodarone, capsaicin, propranolol, and Triton-X100 were previously reported [Citation34–37]. IC50, concentration at which an amphipathic agent inhibited half of the maximum peak whole cell Na+ current from HEK293 cells transfected with NaV1.5. Slope, the hill slope to mechanistically characterize drug behavior based on the slope of fit
Table 2. Effect of capsaicin on pressure-induced NaV1.5 mechanosensitivity in cell-attached patches. Effects of pressure (0 or −30 mmHg) on parameters of macroscopic Na+ currents without (0 µM) or with capsaicin (20 µM): maximum peak Na+ currents normalized to controls at 0 mmHg (IMAX), voltage dependence of activation (V1/2A) or inactivation (V1/2I), time constant of activation (τA), time of inactivation recovery (t1/2R), slope of inactivation recovery (slope), maximum use-dependent inhibition (block), frequency of use-dependent inhibition (ƒ1/2). n = 8–24 cells, *P < 0.05, 0 to −30 mmHg or †P < 0.05, 0 to 20 µM capsaicin by a 2-way ANOVA with Tukey posttest
Table 3. Effect of capsaicin on shear-induced NaV1.5 mechanosensitivity in whole cells. Effects of shear stress (0 or 10 mL/min) on parameters of whole cell Na+ currents without (0 µM) or with capsaicin (20 µM): maximum peak conductance (GMAX), maximum peak current density (IPEAK), voltage dependence of activation (V1/2A) or inactivation (V1/2I), time constants of activation (τA) and fast (τF) or slow inactivation (τS), time of inactivation recovery (t1/2R), slope of inactivation recovery (slope), maximum use-dependent inhibition (block), frequency of use-dependent inhibition (ƒ1/2). n = 8–18 cells, *P < 0.05, 0 to 10 mL/min or †P < 0.05, 0 to 20 µM capsaicin by a 2-way ANOVA with Tukey posttest