Figures & data
Figure 1. Chemical structures of DCPIB, Pranlukast, Zafirlukast, and ZPT.
Figure 2. (a) cartoon representation of a HEK293-YFP(F46L/H148Q/I152L) cell used in the YFP quenching assay. HEK293 cells are engineered to constitutively express YFP(F46L/H148Q/I152L). Endogenous VRAC is activated by a hypotonic challenge allowing iodide influx and subsequent YFP quenching. (b) scatter plot of the 1,184 FDA drug compounds screened. A 3 standard deviation from the mean cutoff was implicated to identify compounds as “hits.” Compounds that slowed the rate of fluorescence quenching had positive values, and compounds that increased fluorescence quenching had negative values. (c) representative traces of YFP-quenching assay with 10 µM ZPT. Traces were normalized to mean of five baseline fluorescent measurements taken at the start of the experiment. Hypotonic solution (130 mOsm) containing DMSO (vehicle) or drug compound was added 10s after the start of the experiment. After 5-min incubation period, 100 mM NaI is added and fluorescence quenching is observed. Fluorescence measurements were taken throughout the entirety of the experiment. Figure is adapted from Figueroa and Denton 2021. AJP-Cell Physiology.
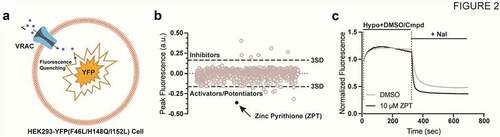
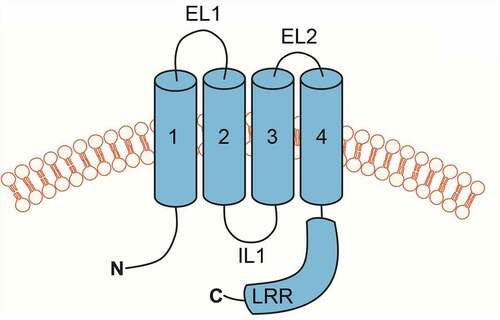
Figure 3. Cartoon depiction of LRRC8 subunit membrane topology. Transmembrane domains are numbered 1–4. Extracellular loop domains 1 (EL1) and 2 (EL2), intracellular loop (IL), and leucine-rich repeat (LRR) domains are also shown.