
Figures & data
Figure 1. Non-negative matrix factorization (NMF) cluster analysis. (a) Kidney renal clear cell carcinoma (KIRC) patients can be divided into four clusters, respectively cluster 1, cluster 2, cluster 3, and cluster 4. (b) Heatmap of the expression of the TRPV family in different clusters. The darker the red, the higher the gene expression, and the darker the blue, the lower the gene expression. (c) Survival curve of different clusters. The prognosis of these clusters is different (P < 0.001). The prognosis for Cluster 1 is poor, while that for Cluster 3 is better. (d) The interaction network of TRPV family members. The relationship between TRPV5 and TRPV6 was the strongest and positively correlated, while that between TRPV3 and TRPV1 was positively correlated and that between TRPV3 and TRPV4 was negatively correlated.
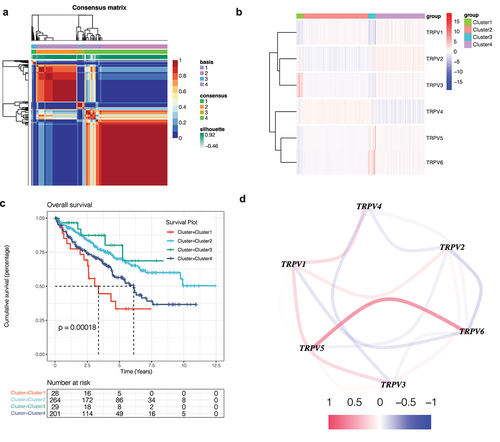
Figure 2. Immune infiltration analysis. (a, b) Bar chart of the immune infiltration level of different clusters. The infiltration level of most immune cells was different among different clusters (P < 0.05), such as activated B cells, activated CD4 T cells, activated CD8 T cells, etc. (c) Heatmap of immune infiltration in different clusters.
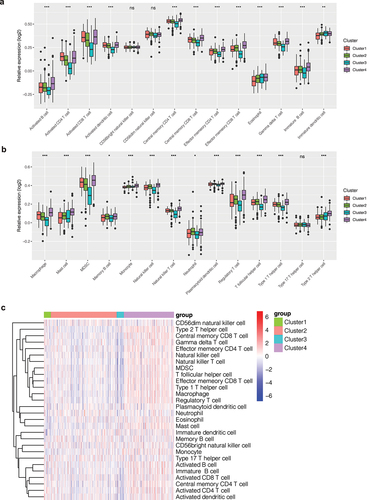
Figure 3. Mutation analysis. (a) The mutation landscape of KIRC. The highest mutation frequencies were VHL and PBRM1. Nonsense Mutation, Frame Shift Del, and Missense Mutation were the most common mutation types in the VHL gene. (b) The mutation symbiosis of the first 20 mutated genes. There was mutation symbiosis between PBRM1 and VHL (P < 0.01). Mutation symbiosis also existed between PBRM1 and SETD2, PBRM1 and USH2A, HMCN1 and TTN, LRP2 and SETD2, MUC16 and BAP1, USH2A and KDM5C, ARID1A and DNAH9, as well as USH2A and CSMD3 (P < 0.05). (c) Differential analysis of tumor mutation load (TMB) among different clusters. There was a significant difference in TMB among different clusters (P < 0.001), and the tumor mutation load in Cluster 3 was low.
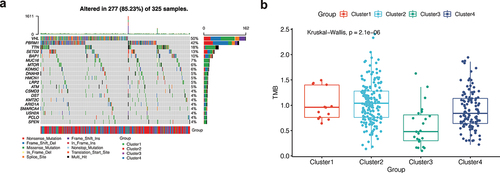
Figure 4. Weighted co-expression network analysis. (a) A soft domain value of 5 is optimal. (b) A total of 14 modules were obtained, and the proportion of gray modules was small. (c) The purple module was most correlated with the cluster.
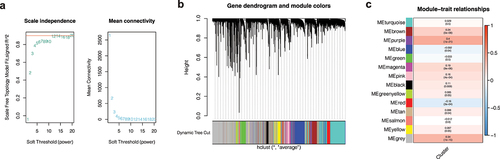
Figure 5. Gene enrichment analysis. (a) Gene ontology (GO) enrichment analysis. The enrichment results of purple module genes were mainly divided into the biological process (BP), cellular component (CC), and molecular function (MF). (b) KEGG enrichment analysis of purple module genes revealed that they were enriched in multiple pathways.
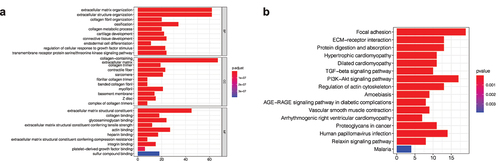
Figure 6. Correlation analysis of clinical features. (a) The expression levels of TRPV3 and TRPV4 are significantly different in patients with different T stages. (b) The expression levels of TRPV2 and TRPV3 are significantly different in patients with different N stages. (c) The correlation between the TRPV family and the M stage, and the results show that only TRPV3 is significantly correlated with different M stages. (d) The correlation between the TRPV family and total stage, and the results showed that only TRPV3 was significantly correlated with different total stages. (e) The relationship between the TRPV family and age (with 65 years as the cutoff value). Only TRPV6 was significantly associated with the two age groups. (f) The relationship between the TRPV family and gender, and the results showed that TRPV3, TRPV4, and TRPV6 were correlated with different genders. (g) TRPV3 was significantly overexpressed in cluster 1. Therefore, TRPV3 can help define cluster 1.
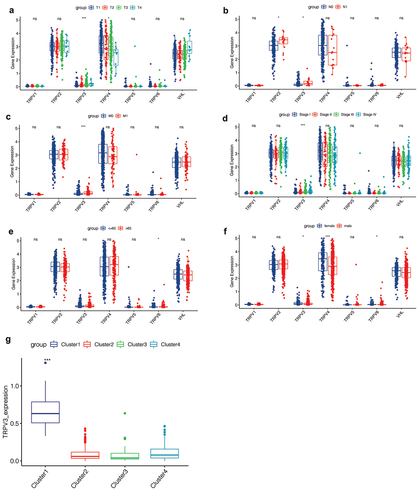
Figure 7. Survival analysis and construction of diagnostic ROC curve. (a-f) The survival analysis of the TRPV family in KIRC. The upregulation of TRPV3, TRPV5, and TRPV6 significantly reduced the overall survival rate of KIRC patients (P < 0.05). However, upregulation of TRPV4 expression was associated with a better prognosis (P < 0.05). (g) It was found that TRPV3 in TRPV family had a high diagnostic value for prognosis, and the AUC value fluctuated around 0.7.
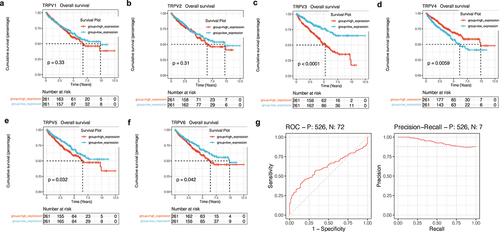
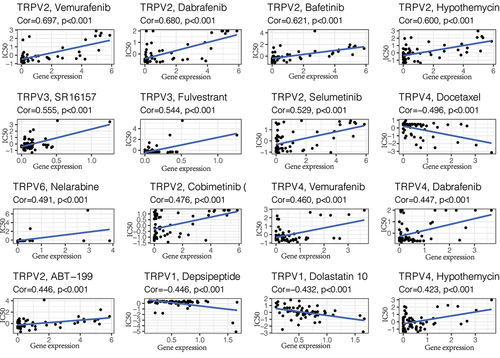
Figure 8. Drug sensitivity analysis. The top 16 predicted chemical drugs related to the TRPV3 in KIRC. Among them, SR16157 and Fulvestrant had the strongest correlation with TRPV3 (P < 0.001).
Supplemental Material
Download Comma-Separated Values File (37.1 KB)Data availability statement
The data that support the findings of this study are openly available in the ICGC database at [http://xena.ucsc.edu/].