
Figures & data
Figure 1. Timing of events from application moment until end of field experiment.
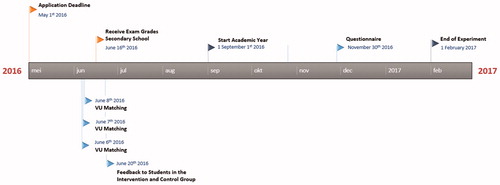
Figure 2. Visual feedback received by students in intervention condition.
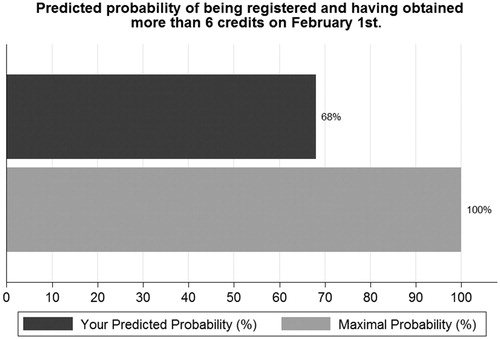
Table 1. Probit estimations future study success.
Figure 3. Comparing predictions of Model (1) and (3).
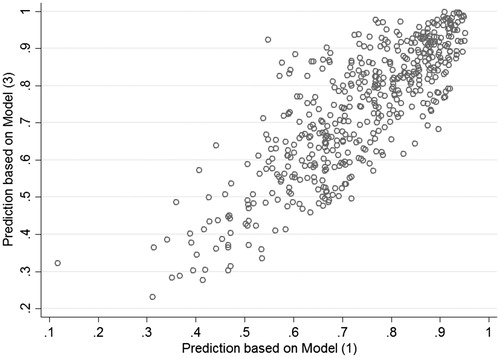
Table 2. Descriptive statistics.
Table 3. Balancing tests.
Figure 4. Self-serving bias: Student versus model predictions. Note. The y-axis represents the density, the x-axis of the top panel represents the difference between the student expectations and the model predictions, and the x-axis of the lower panel represents the student expectations before enrollment.
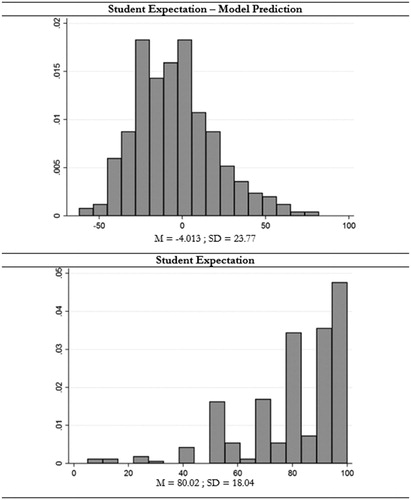
Figure 5. Prevalence of self-serving bias by prediction groups.
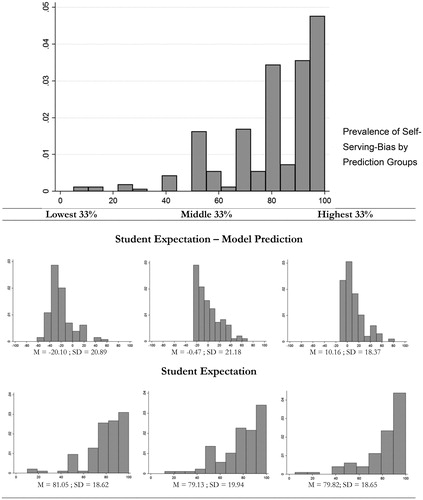
Table 4. Estimation results: Initial enrollment effects.
Figure 6. Enrollment status and model prediction by experimental group. Note. The y-axis represents the density, the x-axis of the top panel represents the difference between the student expectations and the model predictions, and the x-axis of the lower panel represents the student expectations before enrollment.
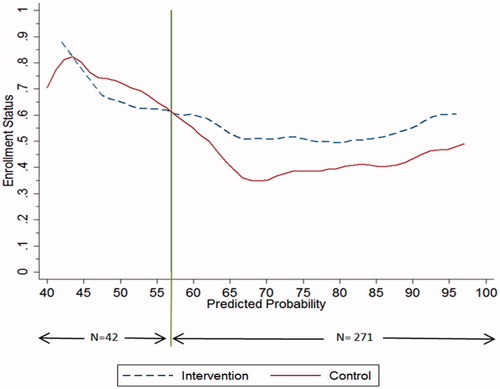
Table 5. Initial enrollment effects by level of self-serving bias and gender.
Table 6. Estimation results: Subsequent enrollment effects.
Table 7. Estimation results: Belief updating.