
Figures & data
Table 1. Descriptive statistics for child and family characteristics.
Table 2. Single-cohort twins approach models fitted to the Sweden 2007 data.
Table 3. Multiple-cohort siblings approach models fitted to the Sweden 2006–2009 data.
Figure 1. Variance partition coefficients for the three series of student achievement models using the (1) Sweden 2007 data and the twin definition of families (, models 1.1, 1.2 and 1.3); and (2) Sweden 2006–2009 data and the fuller definition of families (, models 2.1, 2.2 and 2.3).
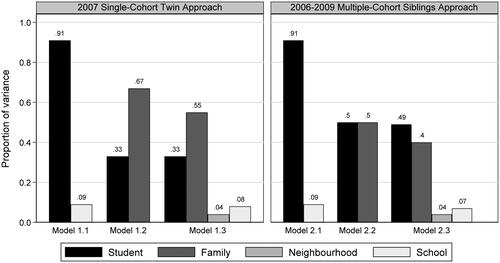
Figure 2. Predicted differences in achievement (SD units) relative to a one-child family by birth order for each family size using the Sweden 2006–2009 data and the fuller definition of families (, model 2.4).
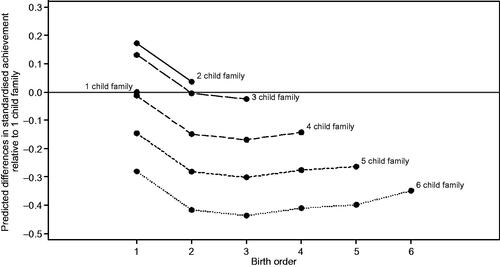
Table 4. Unconditional (Model 2.3) and conditional (Model 2.4) intraclass correlation coefficients for student achievement among siblings, neighbors, and schools.