
Figures & data
Figure 1. Penalty per model parameter that the different fit indices pose on models, depending on sample size.
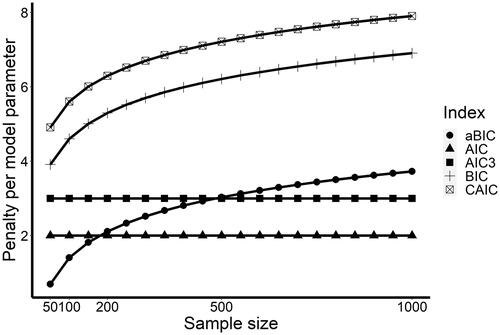
Table 1. Fit indices were obtained in the study by Flaig et al. (Citation2018).
Figure 2. Four latent profiles are defined by patterns of mean values across three indicator variables.
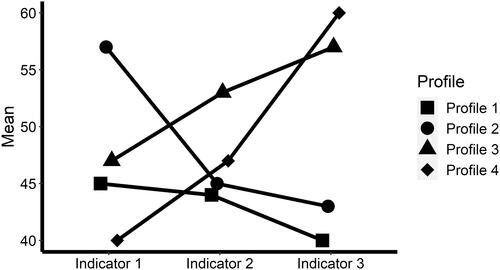
Figure 3. Simulated transitions between the four profiles across the three measurement points. Note. Thicker lines indicate higher probabilities of transitioning between two profiles between two-time points. The thinnest lines indicate a 5% probability, the thickest line is 95%. Percentages at each time point indicate the resulting percentage of learners showing each profile at the respective measurement point.
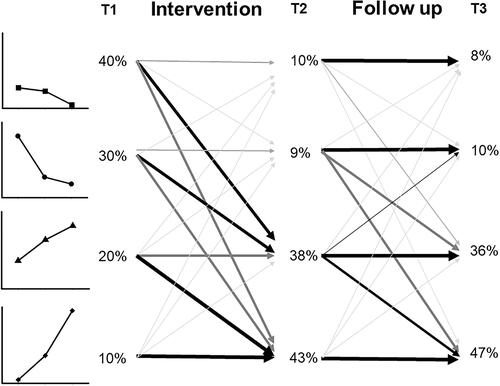
Table 2. Overview of simulated scenarios and study conditions within those scenarios.
Figure 4. Accuracy (proportion of correctly identified models) for the fit indices across all thirty conditions of sample size, entropy, and attrition. Note. A full horizontal line indicates 50% accuracy and dashed lines 33 and 66%.
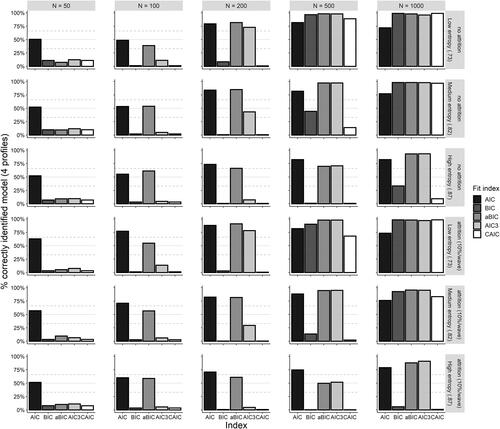
Figure 5. Propensity to indicate the correct model or under- and overfit for different fit indices across sample sizes. Note. 0-line indicates perfect calibration of the fit index at respective sample size, >0 propensity to overfit, <0 propensity to underfit.
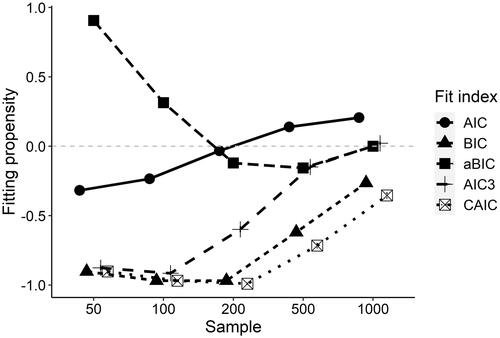
Figure 6. Accuracy of fit indices in the seven robustness check scenarios. Note. A full horizontal line indicates 50% accuracy and dashed lines 33 and 66%.
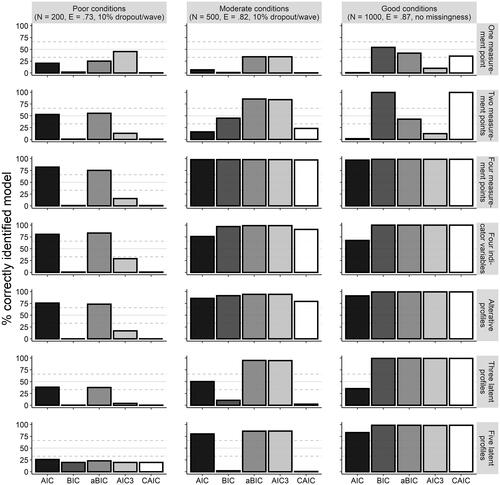
Table 3. Derived guidelines for fit indices for latent transition analysis.