Figures & data
Figure 1. Sequential information of (a) β-actin gene, (b) INS gene and (c) PDX-1 gene. INS: Insulin, PDX-1: Pancreatic and duodenal homeobox 1.
Figure 2. Comparison of blood gas analysis of pregnant rats in ICH group and NC group (n = 8 for ICH and n = 8 for NC). (a) Carbon dioxide partial pressure (PaCO2) and oxygen partial pressure (PaO2); (b) Hydrogen potential (pH); (c) Oxyhemoglobin saturation (SaO2). Data are shown as mean and standard deviation. P-values were calculated by unpaired Student’s t-test. *p < 0.05. ICH: Intrauterine chronic hypoxia, NC: Normal control.
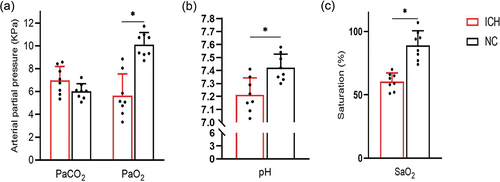
Figure 3. Body weight of offspring rats at different stages after birth in ICH group and NC group (n = 10 for ICH and n = 10 for NC). (a) 12 h after birth, (b) 16 weeks after birth. Data are shown as mean and standard deviation. P-values were gained by using unpaired Student’s t-test. *p < 0.05. ICH: Intrauterine chronic hypoxia, NC: Normal control.
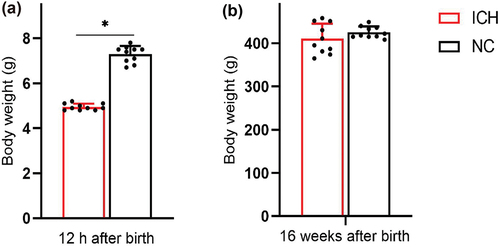
Figure 4. Immunohistochemical results of islets in offspring rats (DAB × 400) (n = 10 for ICH and n = 10 for NC). (a) Islets in ICH group, (b) islets in NC group. (c) INS positive cell area in ICH group, (d) INS positive cell area in NC group. (e) GLUT2 positive cell area in ICH group, (f) GLUT2 positive cell area in NC group. Comparison of (g) total β-cells and (h) islet area of adult male offspring rats in ICH and NC groups. The β-cell positive area of a typical site at low magnification is expressed as a percentage of the pancreatic tissue area observed. (i) Comparison of positive cell area of INS and GLUT2 of adult male offspring rats in ICH group and NC group. Integrated optical density (IOD) values were used to reflect the relative content of positive cell area of substances. Data are shown as mean and standard deviation. P-values were gained by using unpaired Student’s t-test. *p < 0.05. ICH: Intrauterine chronic hypoxia, NC: Normal control, INS: Insulin, GLUT2: Glucose transporter 2.
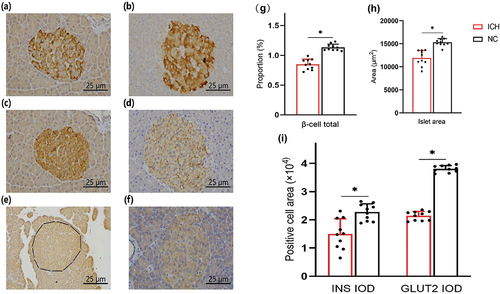
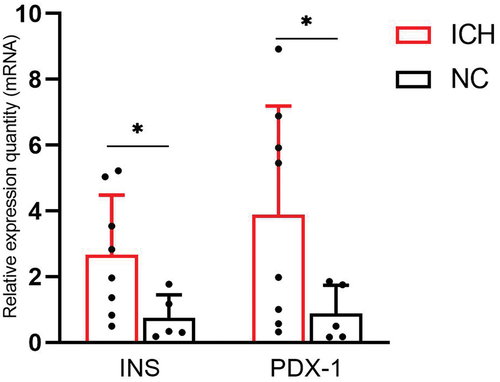
Figure 5. Comparison of relative quantity (RQ) of INS and PDX-1 mRNA of adult male offspring rats in ICH and NC groups (n = 8 for ICH and n = 5 for NC). RQ were used to reflect the relative quantity of the expression of INS and PDX-1 gene. Data are shown as mean and standard deviation. P-values were gained by using unpaired Student’s t-test. *p < 0.05. ICH: Intrauterine chronic hypoxia, NC: Normal control, INS: Insulin, PDX-1: Pancreatic and duodenal homeobox 1.