Figures & data
Figure 1 Croxden sand particle size distribution.
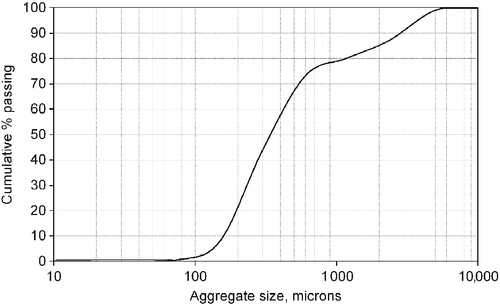
Figure 2 Energy dispersive X-ray analysis from the surface of a Croxden sand grain showing the elemental composition.
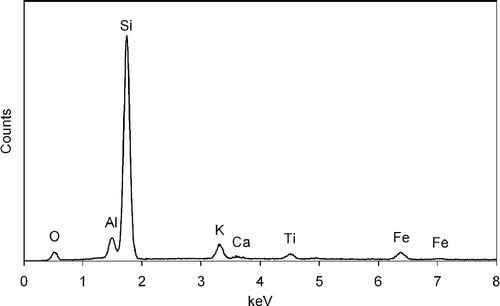
Table 1 Chemical composition of NHL3.5 lime.
Figure 3 Photograph of rig used to monitor shrinkage and creep.
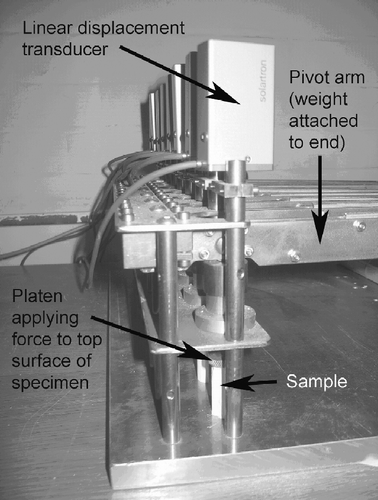
Figure 4 Average curves for samples tested at each of the four load levels.
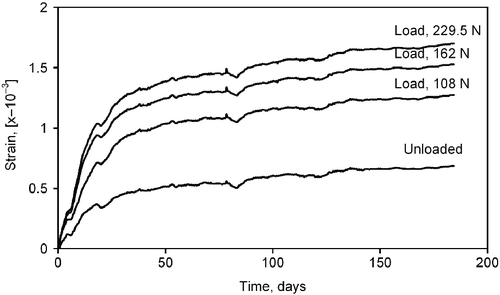
Figure 5 Plot of creep rate against time calculated by subtracting the averaged rate of deformation of the unloaded samples from that of the samples loaded to 225 and 234 N.
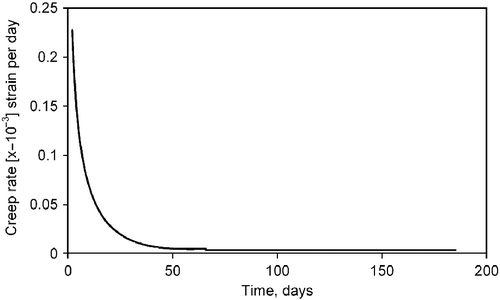
Figure 6 Characterisation of a polished mortar cross section. (a) Backscattered electron image, (b) secondary electron image and (c)–(f) EDX maps of silicon, calcium, aluminium and potassium, respectively.
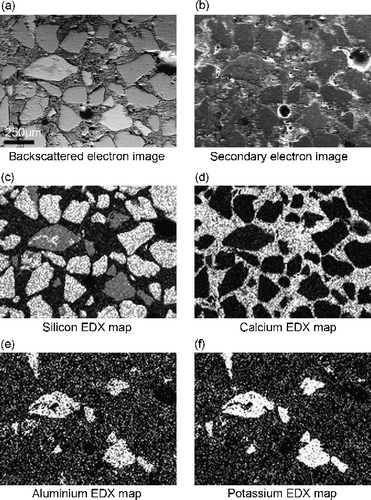
Figure 7 Secondary electron image of mortar fracture surface showing carbonate and silicate phases on the edge of a sand grain (bottom left of image).
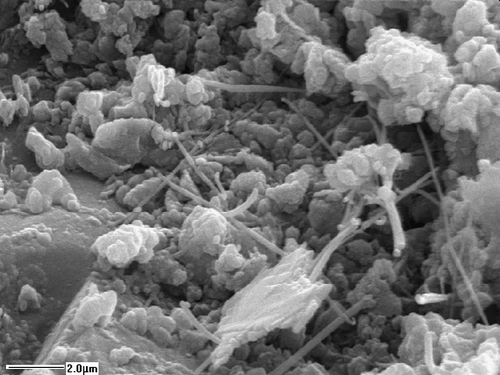
Figure 8 General form of strain–time curve for material subject to deformation (Anderson et al. Citation1990).
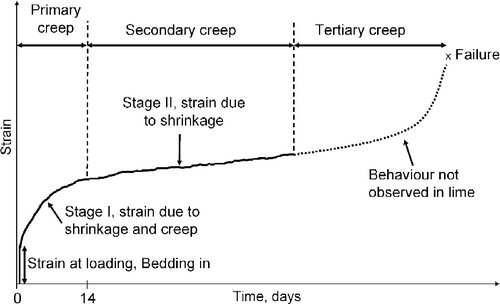
Table 2 Coefficients A and B from exponential equations fitted to creep/shrinkage data.
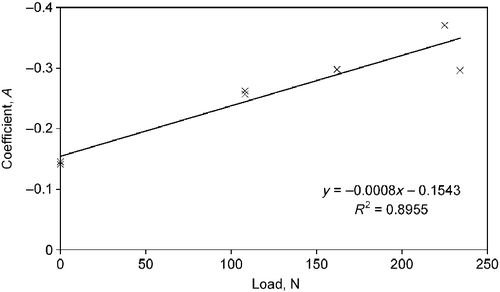
Figure 9 Plot of load applied to specimen against coefficient A from Equation ().