
Figures & data
Table 1. LCA of SOFCs in the scientific literature.
Figure 1. Structures of the considered SOFCs.
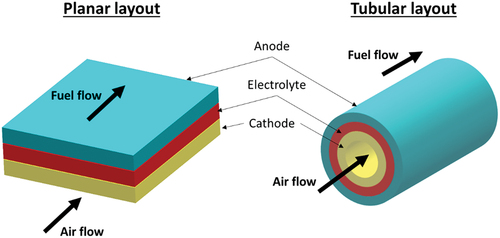
Table 2. Data referred to a single anode-supported SOFC.
Figure 2. System boundaries.
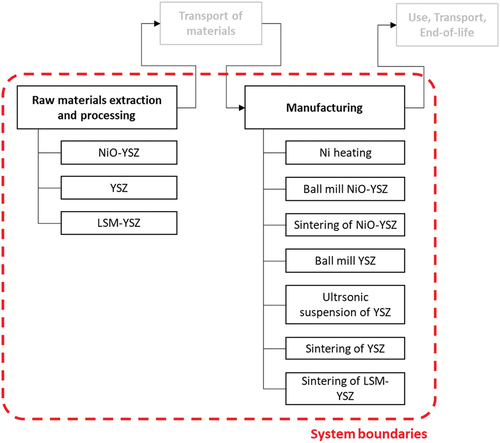
Table 3. Inventory of the current and future SOFCs.
Table 4. GWP impacts [kg CO2 eq.] of components and materials of current SOFCs and future SOFCs.
Table 5. GWP impacts [kg CO2 eq.] of material extraction and manufacturing of current SOFCs and future SOFCs.
Figure 3. GWP impacts comparison of components and materials of current SOFCs and future SOFCs.
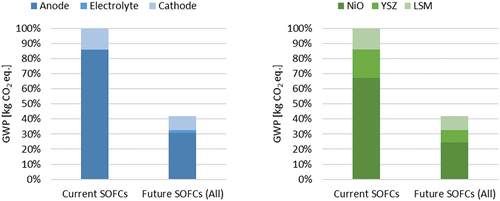
Figure 4. GWP impacts comparison of components and materials of future SOFCs with planar and tubular layout (where 100% is the GWP of current SOFCs).
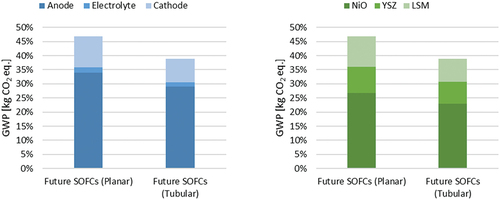
Figure 5. GWP impacts comparison of components and materials of tubular future SOFCs with different diameter to length ratio (where 100% is the GWP of current SOFCs).
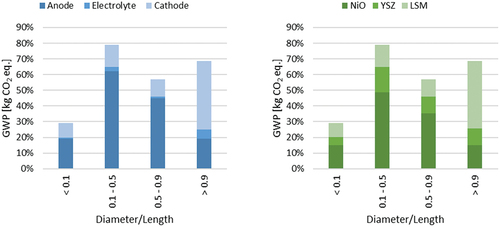
Figure 6. GWP impacts comparison of components and materials of future SOFCs with different specific power (where 100% is the GWP of current SOFCs).
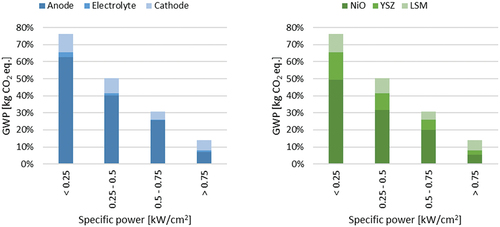
Figure 7. GWP impacts comparison of components and materials of future SOFCs with different active surface (where 100% is the GWP of current SOFCs).
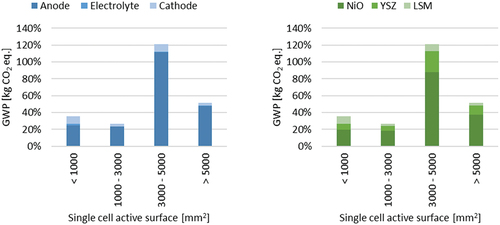
Figure 8. GWP impacts comparison of components and materials of future SOFCs with different thickness of anode, electrolyte and cathode (where 100% is the GWP of current SOFCs).
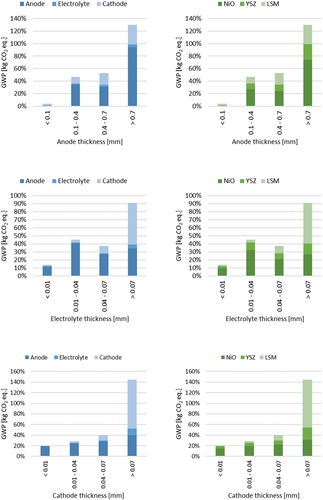
Figure 9. GWP impacts comparison of components and materials of future SOFCs used for stationary and mobile and more dynamic applications (where 100% is the GWP of current SOFCs).
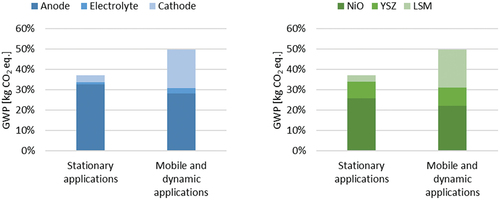
Table A1. Considered patents about the future SOFCs and data extracted from them (where Stat = stationary, Mob = mobile/dynamic).
Data availability statement
Data derived from public domain resources.